The IS-LM model, which stands for investment-saving (IS) and liquidity preference-money supply (LM), is a macroeconomic model that shows how the market for economic goods interacts with the loanable funds market. The IS curve, which stands for investment-saving, shifts whenever there is an autonomous change in consumption, investment, government spending, taxes, or net exports. A reduction in the interest rate results in an upward shift in the aggregate demand curve, leading to a higher equilibrium level of national income. The IS curve shifts right when consumption, investment, government spending, or net exports increase, or when taxes decrease. Conversely, the curve shifts left when these variables decrease or taxes increase. The position of the IS curve is also influenced by exogenous demand, with an increase resulting in an upward shift of the aggregate demand curve.
What You'll Learn
- A reduction in interest rates increases national income
- Interest sensitivity determines the slope of the investment curve
- Marginal propensity to consume impacts the IS curve's slope
- An increase in the tax rate reduces the slope of the aggregate demand curve
- An increase in exogenous demand results in an upward shift of the aggregate demand curve
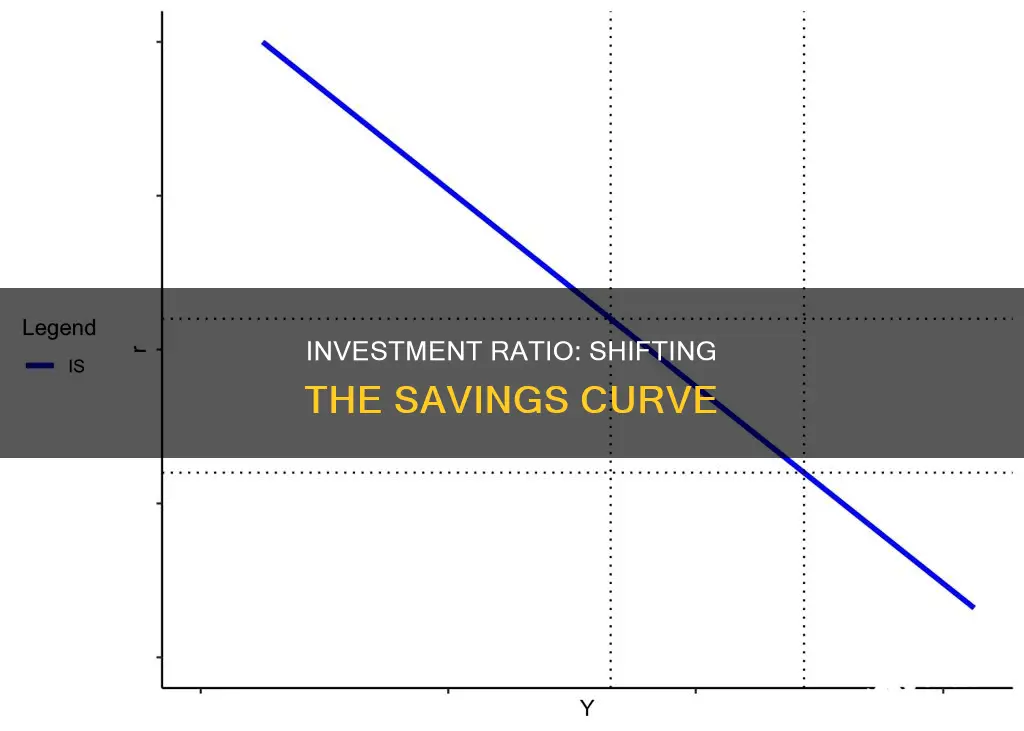
![]()
A reduction in interest rates increases national income
The IS-LM model, which stands for "investment-saving" (IS) and "liquidity preference-money supply" (LM), is a macroeconomic model that shows how the market for economic goods interacts with the loanable funds market, or money market. The IS-LM graph consists of two curves: the IS curve and the LM curve. The IS curve depicts the set of all levels of interest rates and output (GDP) at which total investment (I) equals total saving (S). At lower interest rates, investment is higher, which translates into more total output (GDP), so the IS curve slopes downward and to the right.
Lower interest rates can also lead to inflation, as consumers spend more due to the lower cost of goods and services. However, if inflation is left unchecked, it can lead to a significant loss of purchasing power. Therefore, central banks may need to raise interest rates to stimulate the economy and keep inflation under control.
In addition, a reduction in interest rates can have a positive impact on investment. When interest rates fall, the cost of investing decreases, making it more profitable for businesses to invest. This can lead to an upward shift in the investment function, increasing national income.
Overall, a reduction in interest rates can increase national income by encouraging consumer and business spending, investment, and economic output. However, it is important to monitor inflation and make necessary adjustments to interest rates to ensure economic stability.
Elcid Investments Share Offering: A Guide to Buying In
You may want to see also
![]()
Interest sensitivity determines the slope of the investment curve
The IS-LM model, short for "investment-saving" (IS) and "liquidity preference-money supply" (LM), is a macroeconomic model that illustrates the interplay between the market for economic goods and the loanable funds market, or money market. The IS-LM graph, a graphical representation of the IS-LM model, consists of two curves: the IS curve and the LM curve. The IS curve illustrates the equilibrium between interest rates and output, where total investment equals total savings.
The slope of the IS curve is influenced by interest sensitivity, which is denoted by the coefficient "b". Interest sensitivity refers to the degree to which firms adjust their investment spending relative to changes in the interest rate. A higher interest sensitivity results in a more gradual slope for the IS curve. In this scenario, a slight reduction in the interest rate leads to a significant increase in investment spending due to higher sensitivity. Conversely, a lower interest sensitivity will make the IS curve steeper.
The IS curve's slope is also influenced by the marginal propensity to consume (MPC). An increase in MPC leads to a steeper aggregate demand curve, resulting in a more gradual slope for the IS curve. Additionally, the tax rate impacts the slope of the IS curve. An increase in the tax rate reduces the slope of the aggregate demand curve, making the IS curve steeper.
The IS-LM model provides insights into how changes in market preferences can impact the equilibrium levels of gross domestic product (GDP) and market interest rates. It is a valuable tool for understanding the complex dynamics between the markets for economic goods and financial markets.
Savings and Investments: Impacting Growth Rates
You may want to see also
![]()
Marginal propensity to consume impacts the IS curve's slope
The IS-LM model, which stands for "investment-saving" (IS) and "liquidity preference-money supply" (LM), is a Keynesian macroeconomic model that shows how the market for economic goods interacts with the loanable funds market, or money market. The IS-LM graph examines the relationship between output, or gross domestic product (GDP), and interest rates. The entire economy is boiled down to just two markets—output and money—and their respective supply and demand characteristics push the economy toward an equilibrium point.
The IS curve depicts the set of all levels of interest rates and output (GDP) at which total investment (I) equals total saving (S). At lower interest rates, investment is higher, which translates into more total output (GDP), so the IS curve slopes downward and to the right. The marginal propensity to consume (MPC) is defined as the proportion of an aggregate raise in pay that a consumer spends on the consumption of goods and services, as opposed to saving it. It is calculated as the change in consumption divided by the change in income.
The slope of the consumption function is the marginal propensity to consume. The marginal propensity to consume is the proportion of an increase in income that gets spent on consumption. As income increases, consumption increases due to a positive marginal propensity to consume (MPC). This explains the relation between consumption and income, i.e., the consumption function slopes upward because of this positive income-consumption relation. The more income one has, the more one can spend on consuming goods and services.
The IS-LM model can be used to describe how changes in market preferences alter the equilibrium levels of gross domestic product (GDP) and market interest rates. Shifts in the position and shape of the IS and LM curves, representing changing preferences for liquidity, investment, and consumption, alter the equilibrium levels of income and interest rates.
Retirement Planning: Where to Invest Your Money
You may want to see also
![]()
An increase in the tax rate reduces the slope of the aggregate demand curve
The IS-LM model, which stands for "investment-saving" (IS) and "liquidity preference-money supply" (LM), is a macroeconomic model that illustrates how the market for economic goods interacts with the loanable funds market, or money market. The IS-LM graph consists of two curves: the IS curve and the LM curve. The IS curve illustrates the relationship between interest rates and output, where total investment equals total savings. The LM curve illustrates the relationship between income and interest rates, where money supply equals money demand.
An increase in the tax rate can impact the aggregate demand curve, which represents the total of consumption, investment, government purchases, and net exports at each price level. An increase in taxes reduces disposable personal income, leading to a decrease in consumption and a shift of the aggregate demand curve to the left. This shift reflects a reduction in aggregate demand.
Additionally, changes in income tax rates can cause a rotation of the aggregate expenditures curve, altering its slope and the value of the multiplier. An increase in income tax rates flattens the curve, reducing the multiplier, while a decrease in income tax rates steepens the curve, increasing the multiplier. The multiplier represents the ratio of the change in the quantity of real GDP demanded at each price level to the initial change in one or more components of aggregate demand.
The impact of tax rate changes on the aggregate demand curve is influenced by factors such as consumer confidence, interest rates, and government spending. For example, during periods of high consumer confidence and economic optimism, consumers are more likely to make major purchases, increasing consumption and aggregate demand. Similarly, changes in interest rates can impact investment decisions, affecting the aggregate demand curve.
In summary, an increase in the tax rate reduces the slope of the aggregate demand curve by decreasing disposable personal income, consumption, and aggregate demand. This shift to the left on the aggregate demand curve reflects a reduction in demand. Additionally, changes in income tax rates can cause a rotation of the aggregate expenditures curve, altering its slope and the value of the multiplier. These factors collectively influence the overall shape and position of the aggregate demand curve.
Retirement Reinvention: Shifting Investments for a Secure Future
You may want to see also
![]()
An increase in exogenous demand results in an upward shift of the aggregate demand curve
The IS-LM model, which stands for "investment-saving" (IS) and "liquidity preference-money supply" (LM), is a macroeconomic model that illustrates the interaction between the market for economic goods and the loanable funds market. The IS-LM graph, which consists of the IS and LM curves, examines the relationship between output (gross domestic product or GDP) and interest rates. The IS curve illustrates the set of interest rates and output levels at which total investment equals total savings. The LM curve, on the other hand, represents the set of income and interest rate levels where money supply is equal to money demand.
An increase in exogenous demand, which is demand from outside sources or factors, can lead to an upward shift in the aggregate demand curve. This shift indicates an expansion in the economy, where the total quantity of goods and services demanded increases at any given price level. The aggregate demand curve shifts to the right when its components, namely consumption spending, investment spending, government spending, and net exports (exports minus imports), rise.
An increase in exogenous demand can influence these components of aggregate demand. For example, higher exogenous demand may lead to an increase in consumption spending as consumers have more money to spend. This, in turn, can boost investment spending as businesses respond to the increased demand by investing more in capital goods. Additionally, higher demand may prompt the government to increase spending to meet this demand, further contributing to the upward shift in the aggregate demand curve.
It is important to note that the relationship between exogenous demand and the aggregate demand curve is complex and can be influenced by various factors, such as interest rates, exchange rates, and economic policies. Additionally, the impact of exogenous demand on the curve may vary depending on the specific economic context and the interactions between different components of aggregate demand.
Bitcoin's Promise: Have the Rewards Outweighed the Risks?
You may want to see also
Frequently asked questions
The IS-LM model, which stands for "investment-saving" (IS) and "liquidity preference-money supply" (LM), is a macroeconomic model that shows how the market for economic goods interacts with the loanable funds market, or money market.
The three critical exogenous variables in the IS-LM model are liquidity, investment, and consumption. Liquidity is determined by the size and velocity of the money supply, while the levels of investment and consumption are determined by the marginal decisions of individual actors.
The IS-LM graph examines the relationship between output, or gross domestic product (GDP), and interest rates. It represents the entire economy as two markets—output and money—and shows how their respective supply and demand characteristics push the economy toward an equilibrium point.
The IS curve depicts the set of all levels of interest rates and output (GDP) at which total investment (I) equals total saving (S). At lower interest rates, investment is higher, resulting in more total output (GDP). Thus, the IS curve slopes downward and to the right.
The IS curve shifts whenever an autonomous change occurs in consumption, investment, government spending, taxes, or net exports. An increase in consumption, investment, government spending, or net exports will shift the IS curve to the right, while an increase in taxes will shift it to the left.
The IS curve can be derived from the Keynesian Cross model by incorporating the relationship between real interest rates and planned investment. When real interest rates decrease, planned investment increases, shifting the planned expenditure curve upward and resulting in a higher equilibrium level of GDP.