The volatile nature of the cryptocurrency market makes technical analysis a crucial tool for investors. By using mathematical indicators to evaluate statistical trends, investors can predict price movements and make informed decisions. Technical analysis is based on three assumptions: firstly, that the market reflects all information that could affect the price of a cryptocurrency; secondly, that prices follow a trend; and thirdly, that history repeats itself, allowing analysts to predict future market movements by studying past patterns.
To conduct technical analysis, investors use tools such as candlestick charts, support and resistance levels, moving averages, and the relative strength index (RSI). These tools help identify buy and sell signals, manage risk, and determine profitable entry and exit points.
While technical analysis is a powerful tool, it has limitations and should be combined with fundamental analysis for a more comprehensive understanding of the market. Fundamental analysis considers the underlying factors influencing a cryptocurrency's price, such as community size, network growth, and the technology behind the coin.
By mastering both technical and fundamental analysis, investors can make more informed decisions and increase their chances of success in the complex and ever-changing world of cryptocurrency investments.
| Characteristics | Values |
|---|---|
| Purpose | Predict future price direction |
| Data Used | Historical price data, volume data |
| Tools | Candlestick charts, moving averages, Bollinger Bands, Stochastic Oscillator, Exponential Moving Averages (EMA), MACD Oscillator, Fibonacci, etc. |
| Assumptions | 1. The market discounts itself 2. Price moves in a trend 3. History repeats itself |
| Limitations | Inaccurate due to non-repetition of history, inconsistent results, neglect of community/fundamental factors |
| Complementary Analysis | Fundamental analysis, on-chain analysis |
What You'll Learn
![]()
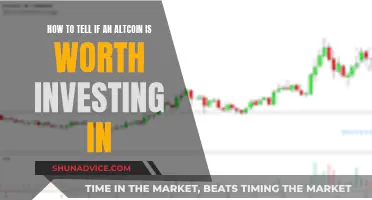
Learn to read candlestick charts
Candlestick charts are a type of visual tool used in technical analysis to show the four important price values of a specific timeframe: open, close, high, and low. They are so-called because the chart consists of "candlesticks" that represent the activity around the timeframe chosen for trade analysis. For example, if you are working within a four-hour timeframe, each candlestick will represent the price movement every four hours.
Candlesticks have two main components: the body and the wicks. The body of the candlestick can either be green or red. A green body indicates that a trade closed higher than its opening price, with the base showing the opening price and the top showing the closing price. Conversely, a red body shows that the trade closed lower than the opening price, with the top of the body indicating the opening price and the base showing the closing price.
The wicks of the candlestick are the vertical lines that appear above and below the body, known as the upper and lower shadows, respectively. The wicks show the highest and lowest prices within the timeframe. The peak of the upper wick indicates the highest transaction price, while the tip of the lower wick shows the lowest transaction price.
The size, colour, and length of the body and wicks of a candlestick provide important information about the current market direction, possible market reversals, and the strength of future price movements. For instance, bullish patterns indicate that the price is likely to rise, while bearish patterns suggest an impending decline.
Traders can use candlestick charts to make informed trading decisions by identifying patterns and analysing the emotions behind price movements. While candlestick charts are considered more complicated than traditional bar charts, they are gaining popularity as more educational material becomes available.
Jamie Dimon's Stance on Crypto Investing
You may want to see also
![]()
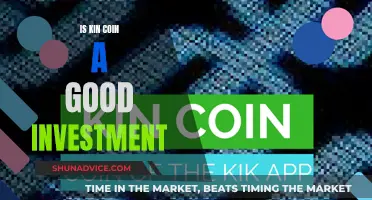
Understand support and resistance levels
Support and resistance levels are foundational concepts in technical analysis for understanding price movements and making strategic trading decisions. These levels represent price thresholds where an asset's price tends to react by reversing or slowing down.
A support level is a price level below which an asset's price typically does not fall. At this level, demand exceeds supply, creating a "cushion" that prevents further price decline. When the price approaches this level, traders anticipate increased demand and a subsequent rise in price.
On the other hand, a resistance level is a price threshold above which the asset's price usually does not rise. Here, supply exceeds demand, limiting further price increases. Traders often interpret reaching this level as a signal to sell, expecting the price to fall due to increased supply.
Support and resistance levels can be identified on price charts by drawing horizontal lines through significant troughs (support) or peaks (resistance). These levels can also be determined using mathematical tools like moving averages and Fibonacci retracement lines.
The identification of support and resistance levels is crucial for traders as it helps them:
- Develop stronger trading plans: By incorporating these levels into their strategies, traders can better navigate the volatile cryptocurrency market, reducing potential losses and increasing earnings.
- Identify market trends: Support and resistance levels provide insights into current market patterns, helping traders make more informed decisions.
- Determine entry and exit points: These levels serve as potential entry and exit points for trades, aiding in risk management and profitable trades.
- Manage risk: Traders can utilise support and resistance levels to place stop-loss orders and define profit-taking levels, minimising potential losses.
It is important to note that support and resistance levels are not static and can change over time. Therefore, traders should regularly reassess these levels and combine them with other analytical tools, such as Fibonacci levels, moving averages, and psychological levels, to enhance their trading strategies and adapt to the dynamic nature of the cryptocurrency market.
Celer Network Coin: A Smart Investment Decision?
You may want to see also
![]()
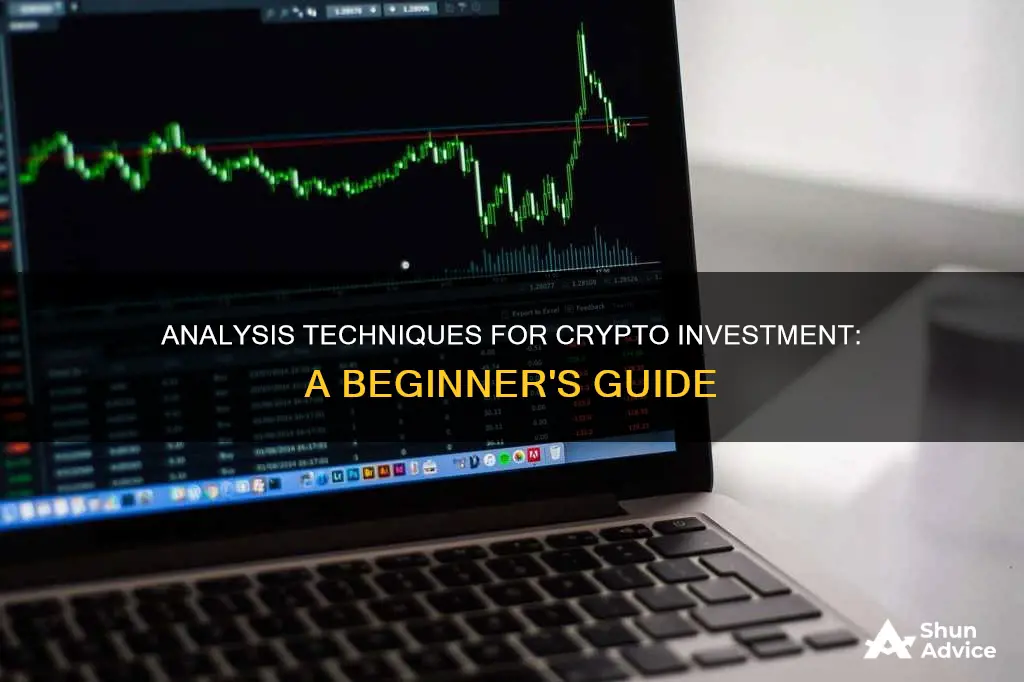
Identify market trends
Identifying market trends is a core skill in making investment decisions. It increases the possibility of making a profit when you enter a trade if the price is trending. Here are some ways to identify market trends in the cryptocurrency market:
Ichimoku Cloud
The Ichimoku Cloud, or Ichimoku Kinko Hyo, is a technical indicator with multiple elements that shows the clear direction of an asset's price. The three elements are:
- TenKan Sen: The average price of the last nine candles, high and low, indicating short-term price sentiment.
- Kijun Sen: The average price of the last 26 candles, high and low, indicating medium-term price sentiment.
- Kumo Cloud: The area considered a strong price reversal zone, formed by the combination of Senkou Span A and Senkou Span B.
The fourth element, Chikou Span, is a lagging span that shows the current price in a line chart 26 periods earlier. If the Chikou Span is above the Kumo Cloud, the market sentiment is bullish; if it's below, the sentiment is bearish.
Golden Cross
The golden cross happens when a short-term moving average crosses above the long-term moving average, indicating an uptrend. In this system, the most reliable moving average values are the price being above the 200 SMA and 50 EMA, pointing to bullishness from both short- and long-term traders. The opposite of the golden cross is the 'death cross', which indicates a downtrend.
Multi-Timeframe Analysis
This method aims to get a macro view of a cryptocurrency's price from higher time frames, then zooming in to identify the price trend based on important support and resistance levels. The steps are:
- Identify Key Levels: These are where prices can start a new trend. Watch the market on a higher timeframe to spot key levels, and expect the price to rebound when it approaches a key level.
- Identify Near-Term Event Level: After identifying a long-term trend, focus on short-term trends. When both short- and long-term trends show the same direction, consider the trend strong.
Candlestick Charts
Candlestick charts are preferred by traders as they show more information about price movement. Each candlestick represents the activity around the chosen timeframe for trade analysis. For example, in a four-hour timeframe, each candlestick will represent the price movement every four hours. Candlesticks consist of a body and wicks. The body is green for an increase or red for a decline. Green candlesticks indicate that a trade closed higher than its opening price, while red candlesticks show that the trade closed lower. The candlestick's wick shows the highest and lowest prices within the timeframe.
Moving Averages
Moving averages track an asset's average price over a specific period and can highlight both long-term and short-term trends. By examining snapshots of an asset's price across various timeframes, traders can identify a "Golden cross", which suggests an impending bullish trend.
Support and Resistance Levels
Support represents a price floor where prices tend to rebound, while resistance acts as a ceiling. Both are vital as they help traders determine when to buy (usually at support) or sell (usually at resistance). Understanding these levels can provide a strategic advantage.
Market Capitalisation
Market capitalisation, or market cap, is equal to the token price multiplied by the total number of tokens in circulation. An increase in market capitalisation shows that the market is excited about the ecosystem and that there is a net capital inflow into the crypto industry.
Volume of Trades
Volume describes the total number of coins or tokens traded during a time period. The trading volume of a coin is typically larger when its price is changing drastically during periods of high volatility. Positive or negative news about a project usually increases the trade volume of a token.
Social Discussions and Sentiment
People discuss everything from a project's upcoming developments to community outreach and bankruptcy declarations on social media platforms like Reddit and Twitter. While going through individual tweets is impractical, data points like the number of followers on Twitter, the tone of discussions on the project's subreddit, and sentiment analysis of the community's feelings at a given time are useful.
Gold Coins: A Smart Investment Decision
You may want to see also
![]()
Recognise trading patterns
Recognising trading patterns is a versatile skill for anyone looking to trade in cryptocurrency. This is a form of technical analysis that focuses on finding patterns in price and volume data. By doing so, traders can identify shifts between rising and falling trends, and execute trades based on these signals.
There are several types of trading patterns to look out for:
Triangles
Triangles are among the most well-known trading patterns. They are formed by converging trend lines and have several varieties, including:
- Ascending triangles: These triangles have a flat resistance line at the top and an ascending support line. This pattern suggests that buyers are more aggressive than sellers, and that a price breakout is likely.
- Descending triangles: This is the opposite of an ascending triangle, with a flat support line at the bottom and a descending resistance line. Descending triangles indicate that sellers are in control, and that a downward breakout is likely.
- Symmetrical triangles: These triangles have converging trend lines that slope upward or downward, indicating a period of indecision in the market.
Rectangles
Rectangle patterns show support and resistance levels running parallel to one another. This pattern is confirmed when there is a breakout in price, which should be followed by a strong continuation on high volume.
Flags and Pennants
Flags and pennants are shorter-term versions of similar patterns. A flag is a shorter-term version of a channel, and is confirmed by a spike in volume on the breakout. This pattern is only genuine if the breakout occurs in the same direction that price entered it.
Head and Shoulders
The head and shoulders pattern is one of the most famous reversal trends. It consists of one great peak (the head) and two smaller ones (the shoulders) on either side. This pattern signals a reversal from a bullish to a bearish trend, or vice versa.
Double Tops and Bottoms
The double top pattern has two swing highs at roughly the same price level, indicating a potential bearish reversal. Conversely, the double bottom pattern has two swing lows, suggesting a bullish reversal.
Cup and Handle
The cup and handle pattern is a bullish continuation pattern. It is formed by multiple rounded lows, giving it the appearance of a teacup with a downward drift, or handle. The volume should decrease towards the middle of the pattern and rise again at the end.
Single-Candle Patterns
Single-candle patterns provide rapid insights into market sentiment. Examples include:
- Doji: This pattern is characterised by its small body, with opening and closing prices nearly the same. It represents market indecision and often signals a potential reversal in the current trend.
- Hammer and Hanging Man: These patterns have small upper bodies and long lower wicks. The hammer appears in a downtrend and suggests a potential upside reversal, while the hanging man forms in an uptrend and indicates a possible downside reversal.
- Shooting Star and Inverted Hammer: These patterns are mirror images. The shooting star occurs in an uptrend and signals a bearish reversal, while the inverted hammer is found in downtrends and forecasts a bullish reversal.
Multi-Candle Patterns
Multi-candle patterns offer a comprehensive view of market trends and sentiment. Examples include:
- Head and Shoulders: This pattern is characterised by three peaks, with the middle one being the highest. It signals a reversal from a bullish to a bearish trend.
- Double Top and Bottom: The double top appears as two consecutive peaks, indicating a potential bearish reversal. The double bottom, on the other hand, has two consecutive troughs, suggesting a bullish reversal.
- Triangle: Triangle patterns are formed by converging trend lines and can be ascending, descending or symmetrical.
- Flags: Flags are short-term continuation patterns that indicate a consolidation period followed by a continuation of the trend.
Other Patterns
Other notable patterns include the rounding tops and bottoms, the bull and bear flag, the bull and bear pennant, and the rising and falling wedge.
By learning to recognise these patterns, traders can gain valuable insights into market trends and make more informed trading decisions.
ENS Coin: A Smart Investment Decision?
You may want to see also
![]()
Know the different types of analysis
There are three main types of cryptocurrency analysis: fundamental analysis, technical analysis, and on-chain analysis. This answer will focus on the latter two, as they are the most relevant to the topic of technical tools and indicators.
Technical Analysis
Technical analysis involves using mathematical indicators to evaluate statistical trends to predict price direction in the crypto market. This is done by looking at past price changes and volume data to determine how the market works and predict how it will affect future price changes. Technical analysts believe that a crypto's past trading activity and price changes are valuable indicators in determining future price and activity.
Technical analysis is based on three assumptions:
- The Market Discounts Itself: Everything that could affect the price of crypto is reflected in its price. You don't need to consider fundamental factors to determine price movements.
- Price Moves In a Trend: Price action exhibits trends, even in random market movements, regardless of the timeframe.
- History Repeats Itself: The repetitive nature of the crypto market means that analyzing previous patterns can help predict future movements.
- Candlestick Chart: Candlesticks show more information about price movement, with each candlestick representing the activity around a chosen timeframe. They consist of a body and wicks, with the body being green for increases and red for declines.
- Support and Resistance: Support and resistance levels are specific price levels that the market struggles to exceed. Support is where prices stop falling, while resistance is where prices can't increase further.
- Moving Averages: This indicator takes the average of past prices over a defined period to help determine market direction and good trade entry prices.
- Relative Strength Index (RSI): The RSI is an oscillator that shows whether an asset is overbought or oversold. It measures on a range of 0 to 100, with below 30 indicating oversold and above 70 indicating overbought.
- Bollinger Bands: These are volatility bands placed above and below a moving average. They contract and expand based on changes in volatility.
- Moving Average Convergence Divergence (MACD): The MACD is plotted with two lines: the difference between two exponential moving averages, and a signal line. It is used for signal line crossovers, with bullish and bearish interpretations.
On-Chain Analysis
On-chain analysis is an emerging field unique to cryptocurrency, which looks at the public data on the blockchain. It is used to predict market moves, gauge market sentiment, and understand why different participants are buying and selling. On-chain analysts examine the behaviour of various market participants, such as institutional investors, exchanges, miners, and retail traders, using signals like wallet balances, coin dormancy, and transaction volume.
Turbo Coin: A Smart Investment Decision?
You may want to see also