Financial ratios are an essential tool for understanding a company's financial health and making informed investment decisions. They are derived from a company's financial statements, such as the balance sheet, income statement, and cash flow statement, and provide valuable insights into its liquidity, profitability, leverage, and efficiency. By analyzing these ratios, investors can assess a company's financial position, performance, and potential for growth, helping them make more confident and strategic investment choices.
| Characteristics | Values |
|---|---|
| Purpose | To gain meaningful information about a company's financial health and make informed investment decisions |
| Data Sources | Financial statements: balance sheet, income statement, and cash flow statement |
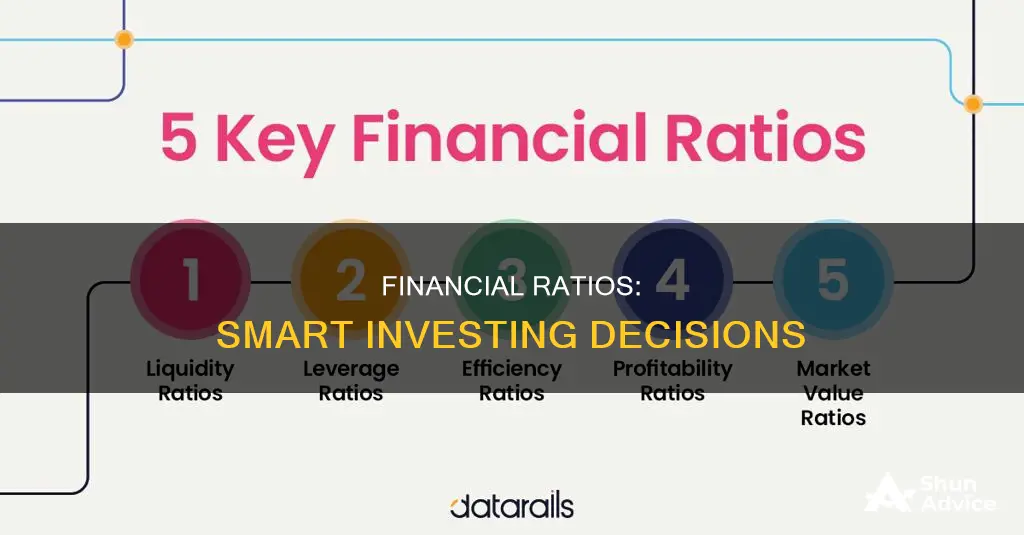
| Types of Ratios | Liquidity, profitability, leverage, efficiency, solvency, market value, coverage, and activity ratios |
| Comparison | Used to compare a company's performance with its competitors and industry averages |
| Users | Internal: management team, employees, and owners |
| External: financial analysts, investors, creditors, competitors, tax authorities, regulatory authorities, and industry observers |
What You'll Learn
![]()
Liquidity ratios
Types of Liquidity Ratios:
Current Ratio:
The current ratio is calculated by dividing current assets (cash, cash equivalents, accounts receivable, etc.) by current liabilities. A current ratio of 1 or higher indicates that a company can cover its short-term liabilities. For instance, a current ratio of 2 means the company's current assets are twice its current liabilities, suggesting good liquidity.
Quick Ratio (Acid-Test Ratio):
The quick ratio is similar to the current ratio but excludes inventory from current assets as it may not be easily converted to cash. This ratio provides a stricter measure of liquidity by focusing on the most liquid assets, such as cash and receivables. It is calculated as:
> Acid-test ratio = (Current assets – Inventories) / Current liabilities
Cash Ratio:
The cash ratio assesses a company's ability to pay off short-term liabilities with cash and cash equivalents. It is calculated as:
> Cash ratio = (Cash + Cash equivalents) / Current liabilities
A cash ratio of 1 indicates that the company has just enough cash and cash equivalents to pay off its short-term debts.
Operating Cash Flow Ratio:
The operating cash flow ratio measures how many times a company can pay off its current liabilities with the cash generated in a given period. It is calculated as:
> Operating cash flow ratio = Operating cash flow / Current liabilities
Importance of Liquidity Ratios:
However, investors should also be cautious of companies with excessively high current ratios, as this may suggest that the company is not utilising its excess cash efficiently for growth opportunities. Therefore, liquidity ratios help investors identify potential red flags and assess a company's ability to handle financial challenges, such as unexpected expenses or emergencies.
Invest in India: CD Investment Strategies and Tips
You may want to see also
![]()
Leverage ratios
There are several types of leverage ratios, and they are calculated differently. Here are some of the most common ones:
Debt-to-Equity Ratio
The debt-to-equity ratio compares a company's total liabilities to its shareholders' equity. It is calculated by dividing total liabilities by total shareholders' equity. A high debt-to-equity ratio indicates that a company has been aggressive in financing its growth with debt, which can result in volatile earnings due to additional interest expenses.
Equity Multiplier
The equity multiplier is similar to the debt-to-equity ratio but replaces debt with assets in the equation. It is calculated by dividing total assets by total equity. Although debt is not explicitly mentioned in the formula, it is an underlying factor since total assets include debt.
Debt-to-Capitalization Ratio
The debt-to-capitalization ratio measures the amount of debt in a company's capital structure. It is calculated by dividing total debt by the sum of debt and shareholders' equity. This ratio helps evaluate a company's financial structure and how it finances its operations.
Degree of Financial Leverage
The degree of financial leverage (DFL) measures the sensitivity of a company's earnings per share (EPS) to changes in its operating income due to fluctuations in its capital structure. It is calculated by dividing the percentage change in EPS by the percentage change in earnings before interest and taxes (EBIT). A higher DFL indicates that earnings are more sensitive to changes in the company's capital structure.
Consumer Leverage Ratio
The consumer leverage ratio quantifies the amount of debt the average consumer holds relative to their disposable income. It is calculated by dividing total household debt by disposable personal income. This ratio is used in economic analysis and by policymakers.
Debt-to-Capital Ratio
The debt-to-capital ratio focuses on the relationship between a company's debt liabilities and its total capital base (total debt plus total shareholders' equity). It is calculated by dividing total debt by total capital. A higher debt-to-capital ratio generally indicates a higher risk of default.
Interest Coverage Ratio
The interest coverage ratio demonstrates a company's ability to make interest payments. It is calculated by dividing operating income by interest expenses. A higher ratio is generally desirable, indicating a stronger ability to pay off debt.
Fixed-Charge Coverage Ratio
The fixed-charge coverage ratio, also known as times interest earned (TIE), is a variation of the interest coverage ratio. It highlights cash flow relative to interest owed on long-term liabilities. It is calculated by dividing earnings before interest and taxes (EBIT) by the interest expense of long-term debts.
Can I Deduct Investment Management Service Fees?
You may want to see also
![]()
Profitability ratios
There are two main types of profitability ratios: margin ratios and return ratios. Margin ratios measure a company's ability to generate income relative to costs and provide insights into a company's ability to turn sales into profit. Return ratios, on the other hand, measure how well a company uses investments to generate returns and wealth for the company and its shareholders.
Some common examples of profitability ratios include:
- Gross Profit Margin: This ratio calculates a company's profitability of production by comparing gross profit (revenue minus cost of goods sold) to revenue. A high gross margin indicates that a company can charge a premium for its products and may have a competitive advantage.
- Operating Profit Margin: This ratio examines the profitability of a business model after accounting for production costs and business operations. It is calculated by subtracting operating costs and direct costs from revenue. A higher operating margin indicates greater profit after taxes, which can be used to cover financial obligations, reinvest in the business, or distribute dividends to owners.
- Net Profit Margin: This ratio assesses a company's overall profitability by comparing net income (revenue minus all expenses) to revenue. A higher net margin indicates more profit available for reinvestment or distribution to shareholders.
- Return on Assets (ROA): ROA measures how efficiently a company uses its assets to generate profit. It is calculated by dividing net income by total assets. A higher ROA indicates better asset utilisation and effective deployment of capital.
- Return on Equity (ROE): ROE measures a company's ability to generate returns on its equity investments. It is calculated by dividing net income by shareholders' equity. A high ROE indicates that a company may be an attractive investment as it can generate cash without relying heavily on debt.
- Return on Invested Capital (ROIC): This ratio reflects how well a company uses capital from all sources (including bondholders and shareholders) to generate returns for investors. It is considered more advanced than ROE as it takes into account all capital used by the company, not just shareholder equity. ROIC is used for internal assessment of capital use and by investors for valuation purposes.
By analysing these profitability ratios, investors can make more informed decisions about potential investments, evaluating a company's financial health, performance, and attractiveness as an investment opportunity.
Data Center Investment: India's Digital Future
You may want to see also
![]()
Solvency ratios
The main solvency ratios include:
- Debt-to-Equity (D/E) Ratio: This ratio indicates how a company is funded, and the likelihood of default. The higher the ratio, the more debt a company has on its books relative to equity.
- Debt-to-Assets Ratio: This ratio measures a company's total debt to its total assets, indicating its ability to pay off its debt with its available assets. A higher ratio suggests that a company is significantly funded by debt and may struggle to meet its obligations.
- Interest Coverage Ratio: This ratio measures how many times a company can cover its current interest payments with its available earnings. A higher ratio indicates a greater margin of safety, while a ratio of 1.5 or below may indicate difficulty in meeting interest payments.
- Equity Ratio: This ratio, or equity-to-assets, shows how much of a company is funded by equity rather than debt. A higher number indicates a healthier company.
When analysing solvency ratios, it is important to compare ratios over time or against other companies in the same industry, as these ratios hold the most value in relative terms. Additionally, it is crucial to consider a variety of ratios to comprehend a company's true financial health, as a single ratio may not provide a comprehensive understanding.
Large US Equity Investment: What You Need to Know
You may want to see also
![]()
Efficiency ratios
- Inventory Turnover Ratio: This assesses how efficiently a company manages its inventory by measuring how many times a company's inventory is sold, used, or replaced over a given period. A high ratio indicates strong sales, while a low ratio suggests low demand for the company's products.
- Accounts Receivable Turnover Ratio: This measures how efficiently a company collects its revenue, telling investors how many times a company collected its average accounts receivable during a given period. A higher ratio indicates better management of customer credit.
- Accounts Payable Turnover Ratio: This ratio measures how quickly a company pays its creditors and suppliers, calculating the average number of times a company pays its account payable balances over a specified period. While a healthy payable turnover rate varies by industry, a high ratio indicates a company is well-positioned to pay off its short-term financial obligations.
- Asset Turnover Ratio: This ratio assesses how efficiently a company uses its assets to generate revenue by dividing a company's net sales by its average total assets. A high asset turnover ratio is considered favourable.
- Operating Expense Ratio: This ratio measures how efficiently a company manages its expenses by comparing the cost of operating a property with the income that property generates. A high operating expense ratio may indicate that a company's expenses are too high, impacting overall efficiency.
However, it is important to note that efficiency ratios have some limitations. For example, changes in inflation, seasonal influences, and variations in accounting practices can impact a company's profitability and make it challenging to use efficiency ratios for comparisons over long periods or across different companies.
Diversifying Investments in India: Strategies for Success
You may want to see also
Frequently asked questions
Financial ratios are calculations derived from a company's financial statements, such as the balance sheet, income statement, and cash flow statement. They help investors analyse a company's financial health, including liquidity, profitability, leverage, and efficiency. By comparing these ratios with competitors and tracking them over time, investors can make more informed investment decisions.
There are several types of financial ratios, including liquidity ratios, profitability ratios, leverage ratios, efficiency ratios, and market value ratios.
- Liquidity ratios measure a company's ability to meet short-term obligations, such as the current ratio and quick ratio.
- Profitability ratios evaluate a company's ability to generate profits relative to revenue and assets, like the gross profit margin and return on assets.
- Leverage ratios assess a company's debt levels, including the debt-to-equity ratio and interest coverage ratio.
- Efficiency ratios analyse how well a company utilises its assets and resources, including inventory turnover and asset turnover ratios.
- Market value ratios evaluate a company's stock price, such as the price-to-earnings ratio.
Calculating financial ratios involves using numerical values from a company's financial statements. For example, to calculate the current ratio, you divide current assets by current liabilities. Interpreting this ratio means understanding that a ratio of 1 indicates the company can meet its short-term obligations, while a ratio above 1 suggests higher liquidity.