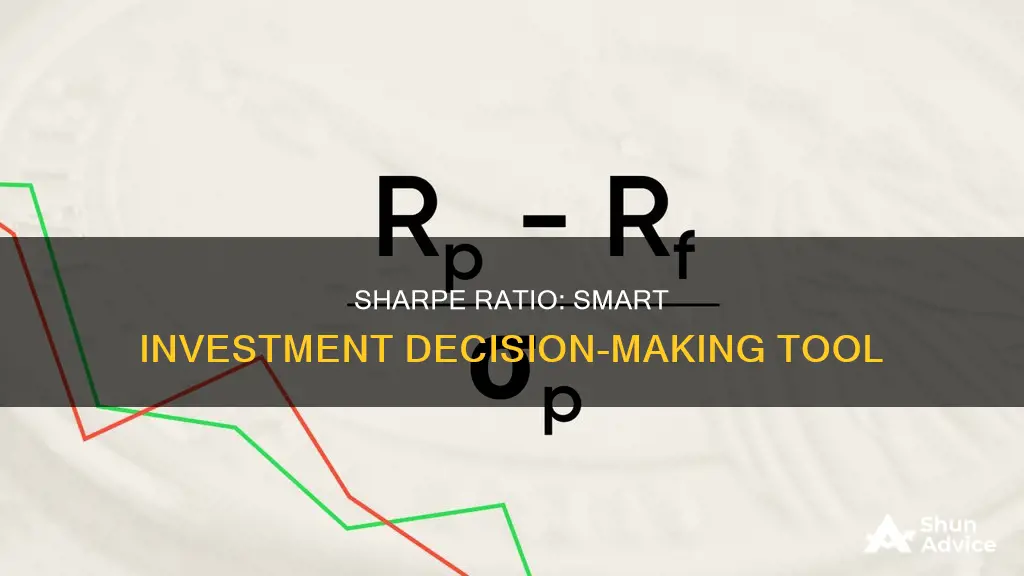
The Sharpe ratio is a financial metric that helps investors compare the return of an investment with its risk. It was developed by economist William F. Sharpe in 1966 and has since become one of the most widely used methods for measuring risk-adjusted returns. The ratio is calculated by subtracting the risk-free rate of return from the expected rate of return and then dividing that result by the standard deviation of the portfolio's excess return. A higher Sharpe ratio indicates better investment performance given the risk involved. The ratio is useful for evaluating investment portfolios or individual stocks, and it can help investors make more informed decisions by considering both returns and risk.
| Characteristics | Values |
|---|---|
| Purpose | To evaluate the return of an investment compared to its risk |
| Formula | (Rx – Rf) / StdDev Rx |
| Rx | Expected portfolio return |
| Rf | Risk-free rate of return |
| StdDev Rx | Standard deviation of portfolio return (or, volatility) |
| Interpretation | A higher ratio indicates better investment performance, given the risk |
| Ratio Grading Thresholds | 1–1.99: Adequate/good; 2–2.99: Very good; Greater than 3: Excellent |
What You'll Learn

Understanding the Sharpe ratio
The Sharpe ratio is a financial metric that helps investors compare the return of an investment with its risk. It was developed by economist William F. Sharpe in 1966 and has since become one of the most widely referenced risk-return measures in finance. The ratio is calculated by subtracting the risk-free rate of return from the expected rate of return, then dividing the resulting figure by the standard deviation.
The Sharpe ratio is useful for evaluating the total performance of an investment portfolio or the performance of an individual stock. It can be used to compare investment opportunities or portfolios, helping investors make more informed decisions by considering both returns and risk. A higher Sharpe ratio indicates better investment performance given the risk.
The ratio is calculated using the following formula:
Sharpe Ratio = (Expected portfolio return - Risk-free rate of return) / Standard deviation of portfolio return (or volatility)
The Sharpe ratio has certain limitations. It assumes a normal distribution of returns, which means that the results are symmetric in relation to the mean. However, in practice, the returns associated with an investment strategy may not always follow a normal distribution. Additionally, the Sharpe ratio is not useful for short-term traders as it is designed to analyse long-term investments.
Despite these limitations, the Sharpe ratio remains a valuable tool for investors. It provides a quick analysis of how investment risk is paying off based on returns and helps investors determine if the risk they have taken on has generated high enough returns compared to the returns they might have seen without taking on risk.
Smart Guide to SIP Investment with SBIMF
You may want to see also

Calculating the Sharpe ratio
The Sharpe ratio, named after its creator, economist William F. Sharpe, is a mathematical expression that helps investors compare the return of an investment with its risk.
The Sharpe ratio is calculated by subtracting the risk-free rate of return from the expected rate of return, then dividing that result by the standard deviation of the portfolio's excess return. This can be represented by the following formula:
Sharpe Ratio = (Expected Return – Risk-Free Rate) / Standard Deviation of Portfolio's Excess Return
Suppose an investment portfolio has an expected return of 10% and a standard deviation of 6%. The risk-free rate is 2.5%.
Using the formula, we can calculate the Sharpe ratio as follows:
Sharpe Ratio = (10% – 2.5%) / 6% = 1.25
So, in this case, the Sharpe ratio is 1.25, indicating that the portfolio's risk-adjusted performance is acceptable relative to the risk-free rate.
It is important to note that the Sharpe ratio has some limitations and may not be suitable for all types of investments. It assumes that asset returns follow a normal distribution, which may not always be the case. Additionally, it is most useful when comparing similar investments, as the risk-free rate and standard deviation can vary significantly across different types of investments.
Schwab Negative Cash: What Does it Mean?
You may want to see also

Interpreting the Sharpe ratio
The Sharpe ratio is a metric used in finance to evaluate the risk-adjusted performance of an investment. It's calculated as the ratio of the difference between the investment's return and the risk-free rate to the standard deviation of its returns. The Sharpe ratio is used to evaluate whether an investment earns the appropriate amount of money, based on the risk.
The Sharpe ratio is defined as the measure of the risk-adjusted return of a financial portfolio and is used to help investors understand the return of an investment compared to its risk. The measure assesses how much risk a trader has taken or is willing to take to generate those returns, otherwise known as the risk/reward ratio.
The Sharpe ratio describes how much excess return you receive for each additional unit of risk you assume. A higher ratio implies a higher investment return compared to the amount of risk of the investment. A Sharpe ratio of 1 or better is good, 2 or better is very good, and 3 or better is excellent. A Sharpe ratio under 1 is generally considered bad.
The Sharpe ratio can be used to compare the risk-adjusted returns of different kinds of investments like shares, ETFs, mutual funds, and investment portfolios. It is calculated by subtracting the risk-free rate of return from the expected rate of return, then dividing the resulting figure by the standard deviation.
The Sharpe ratio is calculated as follows:
[R(p) – R(f)] / S(p)
Where:
- R(p) is the expected portfolio return
- R(f) is the risk-free rate of return
- S(p) is the standard deviation of returns of the portfolio
The numerator of the above formula refers to the so-called excess return, i.e., the difference between the return on the portfolio and the return on risk-free assets. The value of said difference must be positive, because a negative value would mean that the investor could have achieved a better return than the one obtained by the fund's manager had he invested in risk-free financial instruments.
The denominator indicates a parameter representative of the degree of risk of the fund's assets, in other words, the volatility (standard deviation) of the portfolio return. Overall, the Sharpe index measures the increased return obtained by the fund's manager for each additional unit of risk taken.
The Sharpe ratio has a dual use: it helps investors understand which investment fund or portfolio is most efficient in terms of return and risk and, therefore, to identify the best portfolio based on the level of risk investors are willing to take to get that return. In other words, it helps investors understand if a specific fund is consistent with their attitude toward risk.
Maximizing Your BDO Investment: Strategies for Smart Returns
You may want to see also

Using the Sharpe ratio for portfolio management
The Sharpe ratio, named after its creator, William F. Sharpe, is a financial metric that helps investors assess the risk-adjusted return of an investment or portfolio. It compares the return of an investment with its risk, indicating whether the risk taken has generated high enough returns.
The Sharpe ratio can be used to evaluate and optimise portfolios, helping investors make more informed decisions. It is particularly useful for comparing the risk-adjusted performance of different investments and portfolios.
Evaluating Portfolios
The Sharpe ratio can be used to assess the risk-adjusted returns of different portfolios. For example, an investor could compare the risk-adjusted returns of two potential portfolios or their individual component assets. This allows for a more informed decision when selecting a portfolio.
Optimising Portfolios
Portfolio managers can use the Sharpe ratio to optimise the allocation of assets within a portfolio. By incorporating assets with higher Sharpe ratios, investors can potentially increase the overall risk-adjusted returns of the portfolio.
Assessing Existing Portfolios
The Sharpe ratio can also be used to evaluate the risk-adjusted returns of an existing portfolio. This can help investors assess potential changes to their portfolio. For example, an investor with an all-stock portfolio may consider adding other assets with higher Sharpe ratios to improve the overall ratio.
Measuring Risk-Adjusted Performance
The Sharpe ratio allows investors to focus on the money made relative to the risk, rather than just the overall return. This helps in determining whether the risk taken on is generating high enough returns.
Benchmarking
The Sharpe ratio is often used to compare the performance of a portfolio or investment against a benchmark, such as a market index or risk-free investment. This helps investors understand how their portfolio is performing relative to a standard or a risk-free alternative.
Limitations and Considerations
When using the Sharpe ratio for portfolio management, it is important to keep in mind its limitations and considerations:
- Normal Distribution Assumption: The Sharpe ratio assumes that the returns are normally distributed, which means symmetric results with an equal number of data points to the left and right of the mean. However, in practice, investment returns do not always follow a normal distribution, especially in the short term. Hedge funds, for example, often employ dynamic trading strategies that create skewed distributions.
- Long-Term Focus: The Sharpe ratio is designed for analysing long-term investments and may not be suitable for short-term traders. It is important to consider the investment horizon when using the Sharpe ratio, as short-term deviations from the expected holding period can impact the accuracy of the ratio.
- Sensitivity to Risk-Free Rate: The Sharpe ratio heavily depends on the benchmark used for the risk-free rate, which can vary across different investments. It is important to select appropriate benchmarks with similar risk profiles and durations to the investments being evaluated.
- Volatility and Leverage: While the Sharpe ratio takes into account volatility, it may not fully capture the impact of leverage or debt. High leverage can increase downside risks, and if the standard deviation rises significantly, the Sharpe ratio can decline sharply.
The Sharpe ratio is a valuable tool for portfolio management, providing insights into the risk-adjusted performance of investments and portfolios. It helps investors evaluate, optimise, and assess their portfolios by comparing returns to risk. However, it is important to be aware of the limitations and considerations to ensure accurate interpretation and decision-making.
Cash-Rich Investments: Strategies for Financial Freedom
You may want to see also

Using the Sharpe ratio for individual investment decisions
The Sharpe ratio is a financial metric that helps individuals determine whether the risk they've taken on has generated high enough returns compared to the returns they might have seen without taking on that risk. It was developed by William F. Sharpe in 1966 as an investment performance analysis tool, for which he won the Nobel Prize in Economic Sciences.
The ratio is calculated by subtracting the risk-free rate of return from the expected rate of return, then dividing the resulting figure by the standard deviation. The risk-free rate of return is typically the yield on a medium-term government bond, such as a US Treasury bill or note, as these are unlikely to default. The standard deviation is a measurement of volatility, indicating how much a return fluctuates over a period of time.
The Sharpe ratio can be used to evaluate the risk-adjusted returns of an individual asset. This can help determine whether an asset is a suitable investment. For example, if you have an exchange-traded fund (ETF) with a 5-year, 30% return, and the 5-year Treasury rate is 0.83%, with a standard deviation of 20%, the Sharpe ratio calculation is:
30 – 0.83) ÷ 20 = 1.46
A higher Sharpe ratio indicates that the returns are worth the level of risk taken on. A ratio of 1 or more is considered good, with 2 or more considered very good, and 3 or more considered excellent. A ratio under 1 indicates that the risk is not being offset enough by the returns.
It's important to note that the Sharpe ratio assumes a normal distribution of returns, which is not always the case in the real world of financial markets. It is also not useful for short-term traders as it is designed to analyse long-term investments.
Cash in Your Investment Allocation: Wise or Unwise?
You may want to see also
Frequently asked questions
The Sharpe ratio is a financial metric that shows how an investment is performing relative to its risk. It was developed by economist William Sharpe in 1966 and is calculated by subtracting the risk-free rate of return from the expected rate of return of a portfolio, and then dividing that figure by the standard deviation of the portfolio's excess return.
A higher Sharpe ratio indicates better investment performance given the risk. Generally, a ratio of 1 or above is considered good, a ratio of 2 or higher is very good, and a ratio of 3 or more is excellent.
The Sharpe ratio assumes that an investment's returns are normally distributed, which means that the results are symmetric in relation to the mean. In practice, the returns associated with an investment strategy may not always follow this pattern. The ratio is also not very useful for short-term traders as it is designed to analyze long-term investments.


