Financial ratios are an essential tool for investors to assess a company's financial health and make informed decisions about potential investments. These ratios provide a comprehensive view of a company's performance and help identify potential red flags. While there are several ratios to consider, some of the most common and critical ones include:
1. Price-Earnings Ratio (PE): This ratio indicates how many years' worth of profits an investor is paying for a stock. It is calculated by dividing the stock price by earnings per share (EPS). A lower PE ratio generally indicates a more favourable investment opportunity.
2. Price-to-Earnings Growth (PEG) Ratio: The PEG ratio, invented by Benjamin Graham, assesses the discount or premium paid for a company's growth. It is calculated by dividing the PE ratio by the expected annualised earnings growth rate. A PEG ratio below 1 suggests a company is undervalued.
3. Price-to-Sales (PS) Ratio: Popularised by investment manager Ken Fisher, this ratio measures how much an investor pays for every dollar in annual sales. It is calculated by dividing a company's market capitalisation by total sales over the past 12 months.
4. Price-to-Cash Flow (PCF) Ratio: The PCF ratio provides a straightforward comparison by excluding non-cash expenses like amortisation and depreciation. It is calculated by dividing the stock's share price by its operating cash flow over the previous 12 months.
5. Price-to-Book Value (PBV) Ratio: The PBV ratio approximates the value of a company's assets if it were to cease operations and liquidate. It is calculated by dividing market capitalisation by the difference between total assets and total liabilities.
6. Debt-to-Equity Ratio: This ratio measures the degree to which a company's operations are funded by debt compared to shareholder equity. It is calculated by dividing total debt by shareholder equity, with a lower percentage being preferable.
7. Return on Equity (ROE): The ROE measures a company's efficiency in generating profits from investments. It is calculated by dividing net income by shareholder equity, with a higher ROE indicating better profitability.
8. Return on Assets (ROA): The ROA assesses management's effectiveness by measuring how efficiently a company can grow profits from its assets. It is calculated by dividing net income by total assets.
9. Earnings Per Share (EPS): EPS measures a company's profitability and is calculated by dividing net income by the weighted average number of common shares. A higher EPS indicates greater value.
10. Price-to-Book (P/B) Ratio: The P/B ratio compares a company's market value (market capitalisation) to its book value or the value of its assets if liquidated. It is calculated by dividing the market price of a share by the book value per share.
| Characteristics | Values |
|---|---|
| Earnings per share (EPS) | Measure of a company's profitability |
| Price/earnings ratio (P/E) | Compares a company's stock price to its earnings per share |
| Return on equity (ROE) | Measures a company's efficiency at generating profits from money invested |
| Debt-to-capital ratio | Indicates how much of a company is financed by debt |
| Interest coverage ratio (ICR) | Measures whether a company can support the amount of debt it has |
| Enterprise value to EBIT | A more advanced version of the P/E ratio |
| Operating margin | Measures the profitability of a business's core operations |
| Quick ratio | Measures whether a company can meet its short-term obligations with its most liquid assets |
| Price-to-book ratio (P/B) | Compares a company's market value to its book value |
| Dividend yield or the dividend-price ratio | Indicates the returns investors can expect on their investment |
| Debt-to-equity ratio (D/E) | Overview of a company's debts and equity |
What You'll Learn
![]()
Price-to-Earnings Ratio (P/E)
The price-to-earnings (P/E) ratio is a valuation ratio that compares a company's stock price to its earnings per share (EPS). It is calculated by dividing the market value price per share by the company's EPS. The P/E ratio is a valuable tool for investors as it helps them determine a stock's market value and potential for growth. It also indicates whether a stock is overvalued or undervalued.
The P/E ratio is one of the most widely used metrics by investors and analysts for stock valuation. It is used to assess the relative value of a company's stock and can be compared to a company's historical performance, other firms within its industry, or the broader market.
A high P/E ratio could mean that a company's stock is overvalued, while a low P/E ratio could indicate that the stock is undervalued. However, it is important to compare companies within the same industry, as different industries have substantially different P/E ratios. Additionally, the P/E ratio does not factor in future earnings growth, so it may not always reflect a company's expected growth rate.
To address the limitations of the P/E ratio, investors often use other ratios, such as the price-to-earnings-to-growth (PEG) ratio, which takes into account both earnings and expected growth rates.
When analysing a stock using the P/E ratio, it is important to compare the company's current P/E to its historical P/E range and, if appropriate, to the P/E ratios of similar companies in the same industry. This can help investors identify undervalued or overvalued stocks and make more informed investment decisions.
Young Investors: Excited or Apprehensive?
You may want to see also
![]()
Return on Equity (ROE)
The ROE formula is:
ROE = Net Income / Shareholders’ Equity
ROE is a two-part ratio as it brings together the income statement and the balance sheet, where net income or profit is compared to the shareholders' equity. The number represents the total return on equity capital and shows the firm's ability to turn equity investments into profits. It measures the profits made for each dollar from shareholders' equity.
A sustainable and increasing ROE over time can mean a company is good at generating shareholder value because it knows how to reinvest its earnings wisely, thus increasing productivity and profits. Conversely, a declining ROE can mean that management is making poor decisions on reinvesting capital in unproductive assets.
ROE is most useful when comparing companies within the same industry, as each industry has different characteristics that will alter their profits and use of financing.
ROE can also be derived by dividing the firm's dividend growth rate by its earnings retention rate (1 - dividend payout ratio).
ROE can be alternatively calculated using DuPont analysis, which breaks down ROE into three key components, all of which are helpful when thinking about a firm's profitability:
ROE = Net Profit Margin x Asset Turnover x Equity Multiplier
ROE is an important financial metric that investors can use to determine how efficient management is at utilizing equity financing provided by shareholders. It compares the net income to the equity of the firm. However, it does not consider a company's entire financing structure, industry, or performance against the competition without further analysis.
Cruise Investments: Worth the Money?
You may want to see also
![]()
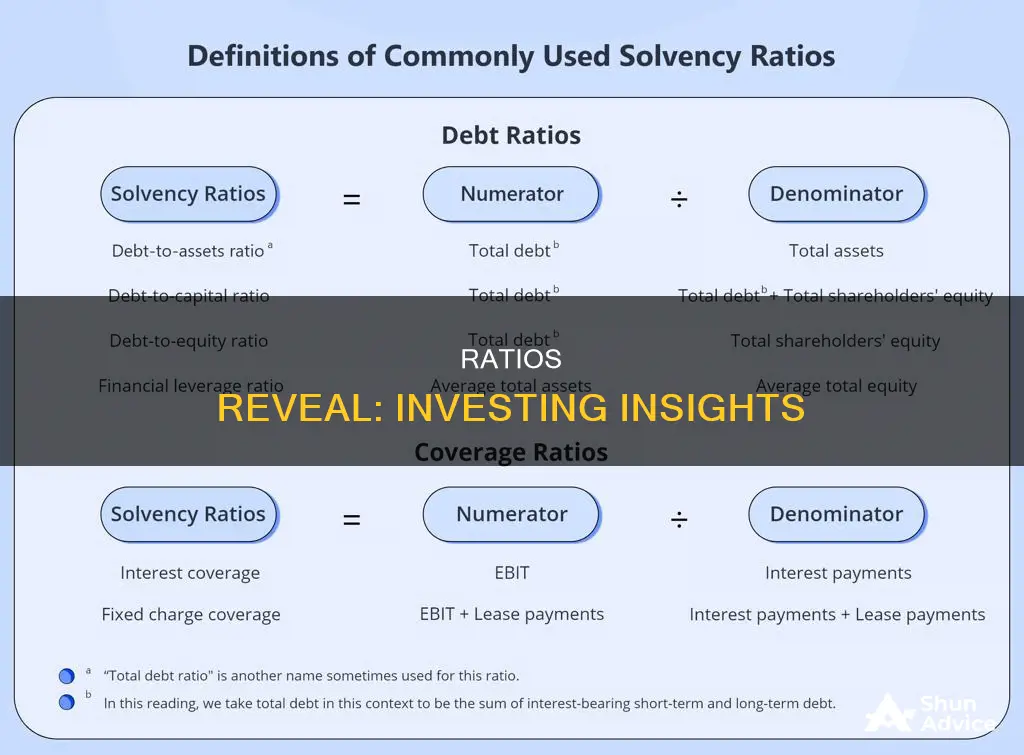
Debt-to-Equity Ratio
The debt-to-equity ratio is a financial leverage ratio that can be helpful when attempting to understand a company's economic health and if an investment is worthwhile or not. It is considered a gearing ratio that compares a company's total liabilities to its shareholder equity. It is widely considered one of the most important corporate valuation metrics because it highlights a company's dependence on borrowed funds and its ability to meet those financial obligations.
The debt-to-equity ratio is calculated by dividing a company's total debt by its shareholder equity. The ratio highlights how a company's capital structure is tilted toward either debt or equity financing. A higher debt-equity ratio indicates a levered firm, which is preferable for a stable company with significant cash flow generation. Conversely, a lower ratio indicates a firm that is less levered and closer to being fully equity-financed.
The debt-to-equity ratio is an important metric in corporate finance and is used to evaluate a company's financial leverage. It is a measure of the degree to which a company is financing its operations with debt rather than its own resources. The ratio can be used to assess the extent of a company's reliance on debt. A higher ratio suggests more risk, while a particularly low one may indicate that a business is not taking advantage of debt financing to expand.
The optimal debt-to-equity ratio varies by industry, but it should not be above a level of 2.0. A ratio of 2 indicates that the company derives two-thirds of its capital financing from debt and one-third from shareholder equity. A company with a higher ratio than its industry average may have difficulty securing additional funding.
While debt may be considered a negative in personal finance, analysts and investors want companies to use debt smartly to fund their businesses. Debt allows businesses to leverage a small amount of money into a much larger sum and repay it over time, allowing them to fund expansion projects more quickly and theoretically increase profits at an accelerated rate.
Investments: Your Future's Best Friend
You may want to see also
![]()
Price-to-Sales Ratio (PS)
The price-to-sales ratio (P/S) is a valuation ratio that compares a company's stock price to its revenues or sales per share. It is calculated by taking a company's market capitalization (the number of outstanding shares multiplied by the share price) and dividing it by the company's total sales or revenue over the past 12 months. The P/S ratio is also known as a sales multiple or revenue multiple.
The P/S ratio is a useful tool for investors and analysts as it shows how much investors are willing to pay per dollar of sales. It can be used to determine whether a stock is undervalued or overvalued. A low P/S ratio could indicate that a stock is undervalued, while a higher-than-average ratio could suggest overvaluation.
For example, if a company is yet to turn a profit, investors can look at the P/S ratio to assess whether the stock is a good investment. If the P/S ratio is lower than that of comparable companies in the same industry that are profitable, investors may consider buying the stock.
The P/S ratio is most relevant when used to compare companies in the same sector, as it does not account for whether a company is making any earnings or will ever make earnings. It also does not take into account a company's debt load or the status of its balance sheet. A company with no debt will be a more attractive investment than a highly leveraged company with the same P/S ratio.
While the P/S ratio does not take debt into account, the enterprise value-to-sales ratio (EV/Sales) does. The EV/Sales ratio is considered superior as it includes a company's long-term debt. However, it involves more steps and is not always readily available.
Seeking Investors for Your Farm?
You may want to see also
![]()
Price-to-Book Ratio (P/B)
The price-to-book ratio, or P/B ratio, is a simple comparison of a company's market value (its market capitalization) to its book value. It is calculated by dividing the company's stock price by its book value per share, which is defined as its total assets minus any liabilities.
The P/B ratio is a useful tool for investors to identify undervalued stocks in the market. A P/B ratio of one means that the stock price is trading in line with the book value of the company. A lower P/B ratio, particularly one below one, indicates that a stock may be undervalued, while a higher P/B ratio suggests that the stock is overvalued or trading at a premium.
However, the P/B ratio has its limitations and should not be the only metric used to evaluate a company's stock. It is most useful for capital-intensive businesses, such as transportation firms or financial businesses with significant assets, as it ignores intangible assets such as brand name, goodwill, patents, and intellectual property. P/B is also not a good indicator for companies with high debt levels or sustained losses, as these can skew the ratio.
Additionally, the P/B ratio should only be used to compare companies within the same industry, as the norm for the ratio varies across sectors.
Songs: The New Investment Avenue
You may want to see also
Frequently asked questions
The price-to-earnings ratio (P/E) is a company's stock price divided by its earnings per share. It is used by investors to determine a stock's potential for growth and whether it is undervalued or overvalued.
The debt-to-equity ratio (D/E) measures how much a company is funding its operations with borrowed money compared to shareholder equity. It indicates whether a company is borrowing too much, which can increase fixed charges, reduce earnings, and pose a risk to shareholders.
The return on equity ratio (ROE) measures a company's profitability and how effectively it uses shareholder money to generate income. It is calculated by taking net income, figured before paying common share dividends and after paying preferred share dividends, and dividing it by total shareholders' equity.
The working capital ratio is a measure of a company's liquidity, or how easily it can turn assets into cash to pay short-term obligations. It is calculated by dividing current assets by current liabilities.