Spreadsheets are a popular and versatile tool for tracking investments and understanding overall portfolio performance. They allow investors to view and sort positions, including entry price, periodic closing prices, and returns. While spreadsheets can be created manually, Google Sheets and Excel offer automated functions that pull in historical and current securities data, providing almost real-time performance updates. This enables investors to make informed decisions based on current market dynamics and adjust their strategies accordingly. Additionally, spreadsheets can calculate performance metrics such as standard deviation, percentage of return, and overall profit and loss, helping investors assess risk and volatility. Ultimately, spreadsheets provide a structured and systematic approach to portfolio management, allowing investors to efficiently track their investments and make informed decisions.
| Characteristics | Values |
|---|---|
| Purpose | Track and understand your portfolio performance |
| Benefits | Privacy, simplicity, flexibility, automation |
| Data | Stock pricing, portfolio value, asset allocation, profit/loss, tax liability, retirement income, entry price, closing price, percentage return, standard deviation |
| Tools | Google Sheets, Excel, Tiller, Google Finance, STOCKHISTORY function, GOOGLEFINANCE function, STDEV function |
| Features | Customizable, real-time data, formulas, charts, graphs, ledgers, watchlists |
| Use Cases | Tracking investments, calculating performance, evaluating asset allocation, comparing to benchmarks, identifying trends, making informed decisions |
What You'll Learn
![]()
Record every transaction with an 'Investment' and 'Sales' ledger tab
Recording every transaction is essential for effective investment management. The 'Investment' and 'Sales Ledger' tabs in your spreadsheet are crucial components for this purpose. Here's a detailed guide on how to set up and utilise these tabs:
The 'Investment Ledger' Tab
The 'Investment Ledger' tab serves as a record of your purchases. Here's a step-by-step process to document each investment transaction:
- Date of Transaction: Begin by entering the date of the transaction. This helps in maintaining a chronological record of your investments.
- Security Name: Next, input the name of the security you are investing in, such as Alphabet Inc. (GOOG) in our example.
- Number of Shares Acquired: In this column, specify the quantity or number of shares you are purchasing.
- Unit Price: Document the price of each unit or share of the security.
- Trade Fee: If applicable, include any fixed-sum trade fees associated with the transaction.
- Commission: Commissions are typically calculated as a percentage of the purchase price. Include this value if relevant.
The 'Sales Ledger' Tab
The 'Sales Ledger' tab is used to record the sales or divestments of your investments. Here's how you can use it:
- Date of Transaction: As with the 'Investment Ledger' tab, start by entering the date of the transaction.
- Security Sold: From the dropdown menu, select the security you have sold. This menu will be populated based on your previous inputs in the 'Investment Ledger' tab.
- Number of Units Sold: Specify the quantity or number of units or shares that you have sold.
- Sale Price: Document the price at which each unit or share was sold.
- Fees or Commissions: If applicable, include any fees or commissions associated with the sale.
By diligently recording each transaction in these ledger tabs, you will have a comprehensive record of your investment activities. This information will be invaluable for tracking the performance of your investments, identifying trends, and making informed decisions about future purchases and sales.
Saving-Investment Model: Understanding the Economics of Macro Theory
You may want to see also
![]()
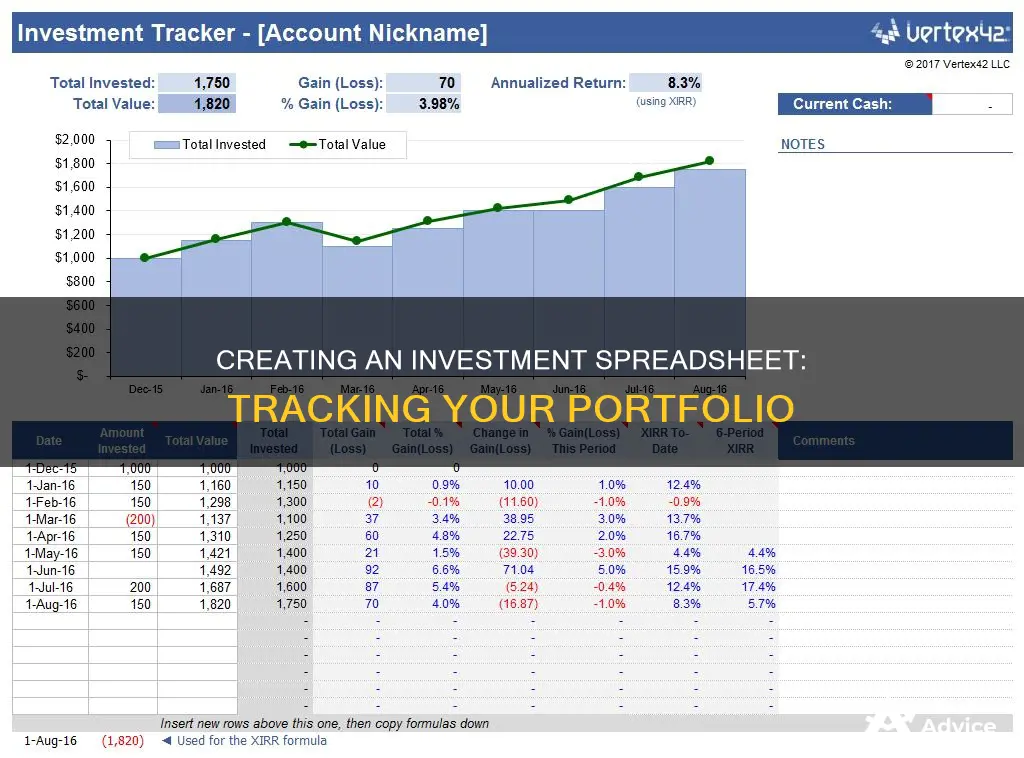
Track the performance of your portfolio
Tracking the performance of your portfolio is essential to understand your financial health and make informed investment decisions. Here are some ways to use a spreadsheet to monitor your portfolio's performance:
Consolidate Your Investment Information
By using a spreadsheet, you can consolidate information about your investments in one place. This is especially useful if you have investments with multiple companies or different types of investments, such as stocks, mutual funds, ETFs, or savings accounts. In your spreadsheet, you can create a master sheet that includes details such as the ticker, price, and number of shares owned for each investment. This gives you an overview of your entire investment portfolio at a glance.
Calculate Current Values and Returns
Spreadsheets allow you to calculate the current value of your investments and track their performance over time. You can use functions like =GOOGLEFINANCE("ticker") in Google Sheets to retrieve the real-time market price of each security. By multiplying the price by the number of shares, you can calculate the current value of each holding. Additionally, you can use formulas in Excel or Google Sheets to calculate the percentage return on your investments. This helps you understand how your investments are performing and identify those that are underperforming or outperforming others.
Compare Performance Against Benchmarks
It's important to compare your portfolio's performance against relevant benchmarks to evaluate how your investments are doing relative to the market. You can use your spreadsheet to track indices such as the Dow Jones Industrial Average, S&P 500 Index, Russell 2000, or the Dow Jones Wilshire 5000. By creating charts or graphs, you can visually compare your portfolio's performance against these benchmarks over time. This helps you identify if your portfolio is keeping pace with the market or if adjustments are needed.
Analyze Historical Data
With a spreadsheet, you can track and analyze historical data for your investments. This includes monitoring the closing price, daily or weekly highs and lows, volume, and other relevant metrics over a specific period. By analyzing historical data, you can identify trends, assess the impact of volatility, and make more informed decisions about buying or selling securities. This long-term perspective can help you make more strategic investment choices.
Evaluate Asset Allocation
Your spreadsheet can also help you evaluate your asset allocation, which is the mix of different types of investments in your portfolio. You can use formulas to calculate the percentage of your portfolio that is allocated to each type of investment, such as stocks, bonds, or cash. By comparing your actual allocation to your desired allocation, you can make more informed decisions about buying or selling assets to align with your investment strategy and risk tolerance.
Monitor Potential Opportunities
In addition to tracking your current investments, you can use a spreadsheet to monitor potential investment opportunities. Create a "Watchlist" tab or sheet to track securities you're considering for future investments. You can use functions to retrieve real-time data and historical performance for these potential investments, helping you identify trends and make informed decisions about when to buy or sell.
Stability of New York Life Investment Management: Secure Future?
You may want to see also
![]()
Monitor the market with a watchlist
A watchlist is a valuable tool for investors to monitor the market and stay ahead in the fast-paced world of investing. Here are some ways to effectively use a watchlist to track and analyse investment opportunities:
Creating a Watchlist: Start by compiling a list of companies and stocks that you find interesting and want to keep an eye on. You can use various methods to create your watchlist, such as "Forking an Idea", where you can leverage pre-existing lists from notable investors or popular investment themes. Alternatively, you can create your own list from scratch by adding stocks that you're interested in.
Tracking Real-time Data: Utilize tools that provide real-time data and price movements for the stocks on your watchlist. This allows you to make timely and informed investment decisions. Look for platforms that offer live price tracking, interactive price charts, and customizable target prices. These features enable you to visualize historical and current data trends and set thresholds for buying or selling.
Setting Price Targets: Save a price target for each stock on your watchlist. This helps you stay disciplined and make informed decisions. You can quickly take action when a stock price nears your target. Additionally, some platforms offer features like Portfolio Integration, which allows you to sync your watchlist with your portfolio for a comprehensive investment overview.
Visualizing Data Trends: Opt for platforms that provide interactive and dynamic price charts. These visual tools enable you to analyze price trajectories, identify patterns, and make strategic investing decisions. Visualizing data trends helps you identify potential buying or selling opportunities and enhances your understanding of the market.
Customizable Alerts and Annotations: Look for features that allow you to set customizable alerts or add personal annotations to your watchlist. For example, you can set a price target and receive an alert when the stock reaches that level, prompting you to review your position. Annotations can include personal insights or reminders directly on the charts, ensuring you don't miss out on critical information.
By effectively utilizing these watchlist features, you can stay informed about market movements, make timely investment decisions, and ultimately improve your investing strategies.
Impact Investment Managers: Creating Positive Change
You may want to see also
![]()
Analyze historical data and performance
Analyzing historical data and performance is crucial for making informed investment decisions. Here are some ways to utilize a spreadsheet for this purpose:
Utilize Formulas and Functions:
- Difference Formulas: Calculate the difference between an asset's current price and its entry price. This helps you identify how much the asset has increased or decreased in value.
- Percent Return Formulas: Determine the percentage return on an asset by calculating the difference between the current price and the entry price, then dividing it by the entry price.
- Profit and Loss Formulas: Calculate profit or loss by multiplying the difference between an asset's current and entry price by the number of shares.
- Standard Deviation Formulas: Assess the risk and volatility of an investment using standard deviation formulas. Standard deviation measures how far returns deviate from their statistical average, providing insight into the above-average risk of an investment.
Track Historical Performance:
- Historical Data: Utilize functions like =GOOGLEFINANCE("GOOG", "price", DATE(2017,2,1), DATE(2017,2,10), "DAILY") in Google Sheets to retrieve historical data for a specific stock, such as Alphabet Inc. (GOOG) in this example.
- Historical Performance Analysis: Analyze how a particular security or your entire portfolio has trended over time by tracking historical performance. This helps identify patterns and make informed decisions.
Compare to Benchmarks:
Compare your portfolio's performance against benchmarks such as the Dow Jones Industrial Average, the S&P 500 Index, the Russell 2000, and the Dow Jones Wilshire 5000. If your portfolio deviates significantly from these benchmarks, it may be time to reconsider your investment strategy.
Visualize with Charts:
- Charts and Graphs: Utilize charts and graphs to visualize your portfolio's performance and compare it with benchmarks. Play with the benchmarks, gridline values, and y-axis values to see more detail in the trend lines.
- Pie Charts: Create pie charts to visually represent your asset allocation, making it easier to understand your portfolio's composition at a glance.
Remember, analyzing historical data and performance is a crucial aspect of investing. By utilizing the tools and techniques mentioned above, you can make more informed decisions and adjust your investment strategy as needed.
Square Enix's India Investment: Exploring New Gaming Frontiers
You may want to see also
![]()
Utilise Google Sheets or Excel
Google Sheets and Excel are both excellent tools for creating investment spreadsheets. They offer a range of functions and formulas that can help you track and analyse your investments. Here are some tips for utilising these platforms effectively:
Google Sheets:
- Google Sheets can automatically pull in current and historical securities data from Google Finance, allowing you to view performance in almost real-time.
- Use the formula =GOOGLEFINANCE("symbol","attribute") to generate a wide range of data for a US stock or mutual fund, where "symbol" is the stock ticker and "attribute" is the specific data you want.
- You can track the opening price, closing price for any date, daily or 52-week highs and lows, average and current daily volume, market cap, EPS, PE, currency, and more.
- To create a chart for a visual representation of price change over time, select the data you want to include (such as date and closing price), then choose "Insert" and "Chart" from the menu.
- Google Sheets also has a function called GOOGLEFINANCE that automatically updates your spreadsheet with the latest prices every 20 minutes.
Excel:
- Excel is a fine tool for keeping track of your investments in an organised manner, enabling you to see and sort positions, including entry price, periodic closing prices, and returns.
- Excel can automatically calculate metrics such as an asset's or portfolio's standard deviation, percentage of return, and overall profit and loss.
- To calculate the difference between an asset's current price and its entry price, click on the cell where you want the difference to appear, type the equals sign, click on the cell with the current price, then type a minus sign and click on the cell with the entry price. Press enter, and the difference will appear.
- To calculate the percentage return, follow the same steps but use the formula: (price-entry) ÷ entry.
- You can also create Profit/Loss Formulas in Excel to calculate the difference multiplied by the number of shares.
- Excel's STOCKHISTORY function retrieves historical data about a financial instrument and loads it as an array.
Both Google Sheets and Excel offer flexibility and a wide range of functions to help you create and customise your investment spreadsheet.
Managing Investment Risks: Options Strategies for Savvy Investors
You may want to see also
Frequently asked questions
An investment spreadsheet is a versatile tool that allows you to track and understand the performance of your financial portfolio over time. It puts all your investment information in one place, making it easier to manage and evaluate.
A spreadsheet can help you track the value of your stocks, mutual funds, ETFs, and more. It enables you to run custom reports, analyse trends, project tax liability, and even visualize retirement income scenarios. Additionally, it can automate current and historical stock pricing data, making it easier to stay up-to-date.
The first step is to decide on the data you want to include. This may include the date, entry price, number of shares, closing prices, percentage return, profit and loss, and standard deviation. You can then input formulas to automatically calculate metrics and track performance.
Creating difference formulas, percent return formulas, profit/loss formulas, and standard deviation formulas are all valuable for tracking investments. These formulas can help you calculate the difference in an asset's price, percentage return, profit or loss, and the risk or volatility of an investment.
Familiarize yourself with the features and functionalities of the spreadsheet software. You can also use benchmarks to evaluate the performance of your portfolio and compare it to industry indices. Additionally, consider using charts and graphs to visualize your data and gain insights into your portfolio's performance and allocation.