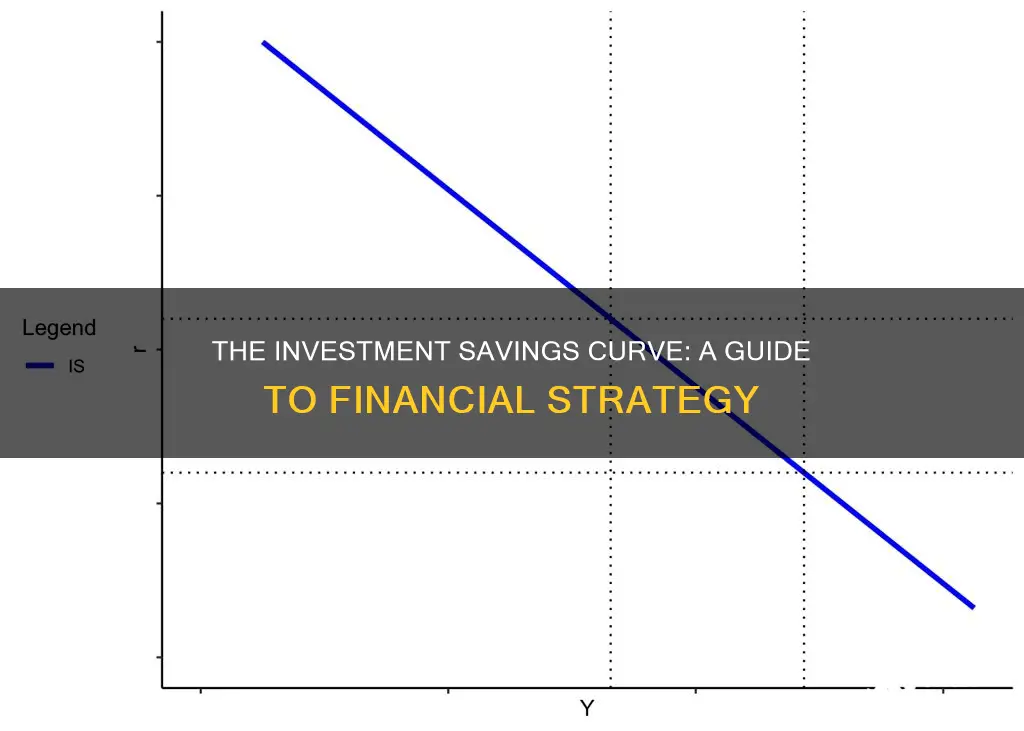
The Investment-Savings (IS) curve is a macroeconomic concept that illustrates the relationship between interest rates and output. It is part of the IS-LM model, which stands for Investment-Saving and Liquidity Preference-Money Supply. The IS curve represents the equilibrium in the goods and services market for various interest rates, showing the combinations of income (Y) and real interest rates (r) where demand for goods equals supply. This occurs when desired national savings equal desired investment. The IS curve is downward-sloping, indicating that lower interest rates encourage higher investment and more spending, leading to an increase in national income and output.
| Characteristics | Values |
|---|---|
| Independent variable | Interest rate |
| Dependent variable | Level of income |
| Shape | Downward-sloping |
| Variables | Interest rate (r), Income (Y), Consumer spending (C), Business investment (I), Government spending (G), Net exports (NX(Y)) |
What You'll Learn
- The IS curve shows the equilibrium level of output for a given interest rate
- The IS curve illustrates the negative relationship between interest rates and output
- The IS curve reflects the equilibrium between investment and aggregate savings
- The IS curve shows the causation from interest rates to planned investment to national income and output
- The IS curve represents the equilibria where total private investment equals total savings

The IS curve shows the equilibrium level of output for a given interest rate
The IS-LM model, or Hicks-Hansen model, is a two-dimensional macroeconomic model that illustrates the relationship between interest rates and output in the short run in a closed economy. The IS-LM model, which stands for "investment-saving" (IS) and "liquidity preference-money supply" (LM), is a Keynesian macroeconomic model that shows how the market for economic goods interacts with the loanable funds market, or money market.
The IS curve, or the investment-saving curve, shows the causation from interest rates to planned investment to national income and output. The independent variable is the interest rate, and the dependent variable is the level of income. The IS curve is drawn as downward-sloping with the interest rate on the vertical axis and GDP on the horizontal axis.
The IS curve represents the locus where total spending (consumer spending + planned private investment + government purchases + net exports) equals total output (real income or GDP). It also represents the equilibria where total private investment equals total savings, with savings including consumer savings, government savings (budget surplus), and foreign savings (trade surplus).
The level of real GDP is determined along the IS curve for each interest rate. Every level of the real interest rate will generate a certain level of investment and spending. Lower interest rates encourage higher investment and more spending. The multiplier effect of an increase in fixed investment resulting from a lower interest rate raises real GDP, explaining the downward slope of the IS curve.
In summary, the IS curve shows the equilibrium level of output for a given interest rate. It illustrates the causation from interest rates to planned fixed investment to rising national income and output.
529 Savings Plans: Smart Investment Strategies, per Forbes
You may want to see also

The IS curve illustrates the negative relationship between interest rates and output
The IS curve, or the Investment-Savings curve, is a representation of the equilibrium between investment and aggregate savings. It demonstrates the level of output that corresponds to a given interest rate. Essentially, the IS curve shows how interest rates influence planned investment, which in turn affects national income and output.
When interest rates decrease, investment increases. This is because lower interest rates make borrowing more attractive for firms, encouraging them to invest in capital projects. As a result, there is an increase in spending, leading to a rise in national income and output. Conversely, when interest rates increase, investment decreases as borrowing becomes less appealing, resulting in lower spending and a decrease in output.
The IS curve is plotted with the interest rate on the vertical axis and output or GDP on the horizontal axis. The negative relationship between these two variables is reflected in the downward slope of the IS curve. This means that as interest rates increase, output decreases, and vice versa.
The IS curve is an essential component of the IS-LM model, which illustrates the relationship between interest rates and output in a closed economy. The IS-LM model is a pedagogical tool used in macroeconomic teaching, offering insights into the effects of demand shocks and monetary and fiscal policies on output and national income.
Smart Saving and Investing Strategies for Your Kids' Future
You may want to see also

The IS curve reflects the equilibrium between investment and aggregate savings
The IS curve, or the Investment-Savings curve, is a representation of the equilibrium between investment and aggregate savings. It reflects the relationship between interest rates and output in a closed economy. The curve is derived by holding the determinants of saving and investment constant, except for income and the real interest rate. This curve is part of the IS-LM model, which stands for "Investment-Saving" and "Liquidity Preference-Money Supply". It was developed by John Hicks in 1937, based on the theories of John Maynard Keynes.
The IS curve illustrates the equilibrium in the goods and services market for various interest rates. It shows the combinations of income (Y) and the real interest rate (r) where the demand for goods equals the supply of goods, or where desired national savings equal desired investment. The curve is downward-sloping, indicating that as income increases, the real interest rate must decrease to maintain equilibrium. Conversely, when income decreases, the real interest rate must increase to maintain balance.
The IS curve is a useful tool for understanding the short-run equilibrium between interest rates and output. It can be used to analyse how changes in market preferences impact the equilibrium levels of gross domestic product (GDP) and market interest rates. The IS curve is a graphical representation, with GDP or income on the horizontal axis and the interest rate on the vertical axis.
The IS-LM model, of which the IS curve is a part, has been criticised for its simplistic assumptions and limited applicability. However, it continues to be used as a pedagogical tool in macroeconomic teaching, particularly at the introductory level.
Emergency Savings: Invest or Keep?
You may want to see also

The IS curve shows the causation from interest rates to planned investment to national income and output
The IS-LM model, or Hicks–Hansen model, is a two-dimensional macroeconomic model that shows the relationship between interest rates and output in the short run in a closed economy. The IS-LM model describes how aggregate markets for real goods and financial markets interact to balance the rate of interest and total output in the macroeconomy.
The IS curve, or "Investment-Savings curve", shows the causation from interest rates to planned investment to national income and output. The IS curve represents the equilibrium in the goods and service market for various interest rates. It depicts the set of all levels of interest rates and output (GDP) at which total investment (I) equals total saving (S). At lower interest rates, investment is higher, which translates into more total output (GDP), so the IS curve slopes downward and to the right.
The IS curve is drawn with the interest rate (r) on the vertical axis and GDP (gross domestic product: Y) on the horizontal axis. The IS curve represents the locus where total spending (consumer spending + planned private investment + government purchases + net exports) equals total output (real income, Y, or GDP).
The IS curve also represents the equilibria where total private investment equals total saving, with saving equal to consumer saving plus government saving (the budget surplus) plus foreign saving (the trade surplus). The level of real GDP (Y) is determined along this line for each interest rate. Every level of the real interest rate will generate a certain level of investment and spending: lower interest rates encourage higher investment and more spending. The multiplier effect of an increase in fixed investment resulting from a lower interest rate raises real GDP. This explains the downward slope of the IS curve. In summary, the IS curve shows the causation from interest rates to planned fixed investment to rising national income and output.
Solow Model: Investment Savings Strategy for Long-Term Growth
You may want to see also

The IS curve represents the equilibria where total private investment equals total savings
The IS-LM model, or Hicks–Hansen model, is a two-dimensional macroeconomic model that illustrates the relationship between interest rates and output in the short run in a closed economy. The IS-LM model was developed by John Hicks in 1937 and was based on theories published by John Maynard Keynes in 1936. The IS-LM model is a pedagogical tool that shows how the market for economic goods interacts with the loanable funds market, or money market.
The IS curve, or Investment-Savings curve, is a representation of the equilibrium between investment and savings. It depicts the set of all levels of interest rates and output (GDP) at which total investment (I) equals total savings (S). At lower interest rates, investment is typically higher, leading to greater total output (GDP). Therefore, the IS curve slopes downward and to the right.
The IS curve can be defined by the equation:
Y = C(Y - T(Y)) + I(r) + G + NX(Y)
Where:
- Y represents income
- C(Y - T(Y)) represents consumer spending as a function of disposable income (income minus taxes)
- I(r) represents business investment as a function of the real interest rate
- G represents government spending
- NX(Y) represents net exports (exports minus imports) as a function of income
The IS curve illustrates the causation from interest rates to planned investment to national income and output. It shows how changes in interest rates can impact investment decisions and, consequently, the level of economic output. Lower interest rates encourage higher investment and more spending, leading to an increase in real GDP. This relationship is reflected in the downward slope of the IS curve.
In summary, the IS curve represents the equilibria where total private investment equals total savings, and it plays a crucial role in understanding the dynamics between interest rates, investment, and output in the economy.
Unlocking the Power of Savings and Investments
You may want to see also
Frequently asked questions
The investment-savings curve, or IS curve, shows the equilibrium level of output for a given interest rate.
The IS curve represents the equilibrium in the goods and services market for various interest rates. Every point on the curve is an income/real interest rate pair where the demand for goods is equal to the supply of goods.
The IS curve shows a negative relationship between interest rates and output. Lower interest rates encourage higher investment and more spending, leading to an increase in output.
The IS curve is influenced by changes in interest rates and other variables such as fiscal policy, investment, and consumption. Changes in these variables can shift the curve.
The IS curve is used in macroeconomic models, such as the IS-LM model, to analyse the short-run equilibrium between interest rates and output. It helps understand how changes in market preferences impact the equilibrium levels of GDP and market interest rates.


