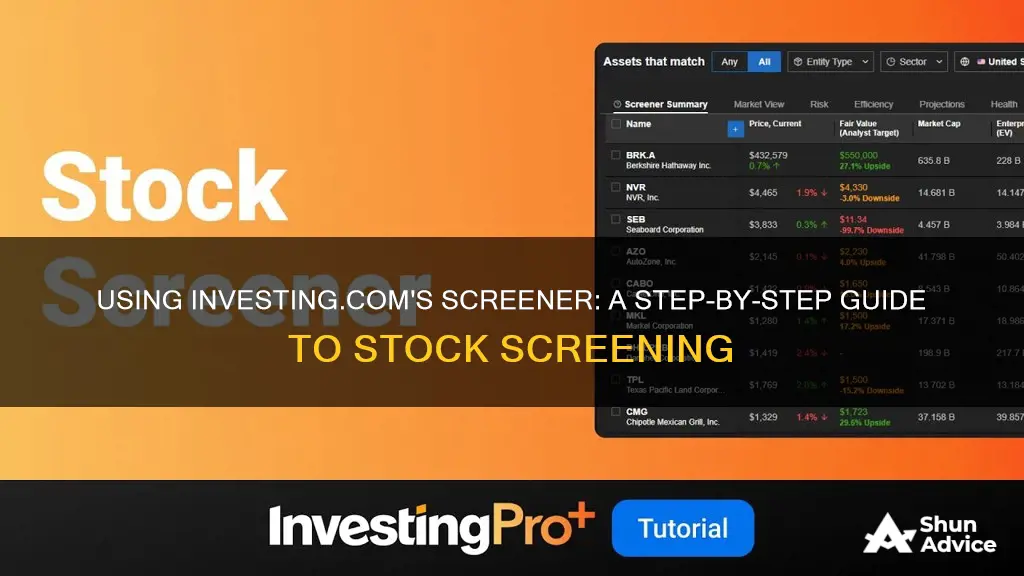
Investing.com's Stock Screener is a powerful tool that enables investors to filter stocks according to a wide range of predetermined criteria. These criteria include share price, market cap, dividend yield, and technical indicators such as RSI and MACD. The screener allows users to select multiple criteria simultaneously, refining their results further. For example, when searching for small-cap American companies, both the country and market cap criteria must be chosen. The results can be downloaded, added to a watchlist, and saved for future use.
| Characteristics | Values |
|---|---|
| Filter criteria | Share price, market cap, dividend yield, RSI, MACD, P/E ratio, 1-year change |
| Country | United States |
| Exchange | N/A |
| Sector | N/A |
| Range selection | Drag sliders or input min/max values |
| Save screen | Yes |
| Adjust overview columns | Yes |
| Download results | Yes, in CSV file format |
| Add to watchlist | Yes |
What You'll Learn

Accessing the screener
To access the Stock Screener on Investing.com, start by going to the '≡ More' option and selecting 'Stock Screener' from the menu. This will open up the screener, where you can begin to input your desired criteria.
The next step is to select the country, exchange, and sector you want to screen for assets. For example, if you are looking for small-cap American companies, you would choose 'United States' as the country and then select the market cap range to be between 80 million and 200 million. You can either drag the sliders to choose this range or input the minimum and maximum values directly.
The Stock Screener allows you to filter for multiple stocks using a wide array of predetermined criteria. You can choose from criteria such as share price, market cap, dividend yield, P/E ratio, RSI, and MACD. The results will appear automatically as you select your criteria.
Once you have chosen your criteria, you can save the screen for future use. You can also adjust the columns in the Overview tab to select the information you want to see in the results, such as technical analysis data or financial information.
Cash Expenditure vs Investment: What's the Difference?
You may want to see also

Selecting the country, exchange and sector
When using the Investing.com stock screener, one of the first steps is to select the country, exchange, and sector that you want to focus on. This is an important step as it will help you narrow down your investment options and focus on the stocks that align with your interests and preferences.
To start, you can select the country or countries that you want to invest in. The screener offers a wide range of countries to choose from, allowing you to invest in domestic or international markets. Simply tick the box next to each country you want to include in your screen. You can select as many countries as you like, but keep in mind that a more focused approach can sometimes be more effective.
Next, you can choose the exchange or exchanges that you want to include. Each country will have its own set of exchanges, and you can select as many or as few as you like. For example, if you're interested in US stocks, you might choose to screen stocks from the New York Stock Exchange (NYSE) or the Nasdaq. If you're investing in UK stocks, you might select the London Stock Exchange (LSE).
After selecting your countries and exchanges, you can then choose a specific sector or sectors that you want to focus on. Sectors represent different areas of the economy and can help you find stocks that align with your interests or areas of expertise. Examples of sectors include healthcare, technology, finance, energy, and utilities. You can select multiple sectors if you wish to cast a wider net, or you can focus on a single sector to narrow your options.
By carefully selecting the country, exchange, and sector, you can tailor your stock screening process to your specific needs and interests. This helps you focus on the most relevant stocks and makes your investment research more efficient and effective. Remember, you can always adjust these selections later if you want to broaden or narrow your search criteria.
Extra Cash? Here's How to Invest Wisely
You may want to see also

Drilling down with criteria
Once you've selected the country, exchange and sector, you can further refine your search using a wide range of criteria. For example, you can filter by share price, market cap, dividend yield, and technical indicators such as RSI and MACD. You can also filter by price, 1-year change, P/E ratio, and more. These criteria are separated into categories like Price, Ratios, and Fundamental.
When looking for specific stocks, you can choose multiple criteria simultaneously. For example, when searching for small-cap American companies, you would select "Country = United States" and "Market Cap = 80M to 200M". You can either drag the sliders or input the minimum and maximum values directly. The results will automatically adjust according to your chosen range.
The Investing.com screener also allows you to adjust the Overview columns. You can select the information or columns that you want to see in the Overview tab of the screener results. This could include technical analysis data, like MACD, or financial information like the P/E ratio.
Additionally, you can download the results in CSV file format, and even add them to an existing watchlist.
A Beginner's Guide to Investing with Ameritrade
You may want to see also

Adjusting overview columns
The Overview tab of the Investing.com stock screener provides a comprehensive summary of the selected stocks' performance. You can customise the information displayed in this section to suit your preferences and investment strategy.
To adjust the overview columns, click on the "Overview" tab. By default, the screener displays the "Performance," "Fundamentals," and "Technical Analysis" sections. Each section contains relevant financial metrics and indicators that provide a quick snapshot of the stock's performance and health.
To customise the columns, click on the settings icon located in the top-right corner of the "Overview" tab. This will open the "Select Columns" window, where you can choose which columns to include in the overview. The available columns are categorised into different groups, such as "Performance," "Dividends," "Valuation," "Margins," and more. Select the columns you want to add or deselect those you want to hide. You can also rearrange the column order by dragging and dropping them to your preferred positions.
Additionally, you can adjust the time frame for the metrics displayed in the "Performance" section. By default, it shows data for the last month, quarter, and year. However, you can customise this by selecting your preferred time ranges, such as 3 months, 6 months, YTD (year-to-date), or even a specific custom range. This allows you to analyse the performance of the stocks over different periods and identify short-term and long-term trends.
Once you've made your selections, click "Save" to apply the changes. Your overview will now display the chosen columns, providing a tailored summary of the stocks' performance based on the metrics and indicators that align with your investment strategy and decision-making process.
Investment Bankers: Using DCF for Smart Decisions
You may want to see also

Downloading results
Once you have applied your chosen filters and are happy with the results, you can download the table by clicking the "Download" link above the table and to the right. You can also adjust the number of rows of results you want to view at once. The results can be downloaded in CSV file format. Please note that you will need a Starter Plan + Data Boost or Professional Plan to export results. If you have more than 100 lines, you will need to narrow down your results to fewer than 100 lines before exporting.
Math in Finance: Investment Bankers' Secret Weapon
You may want to see also
Frequently asked questions
First, go to '≡ More' and select 'Stock Screener'.
You can use a broad array of predetermined criteria such as share price, market cap, dividend yield, and technical indicators including RSI and MACD.
Yes, you can choose multiple criteria simultaneously to further refine your results.
Yes, once you have chosen your criteria, you can save the screen for future use.


