Excel is a powerful tool for managing and analyzing investments, offering a range of functions and formulas to help investors make informed decisions. Whether you're tracking a portfolio, calculating returns, or assessing risk, Excel provides a structured and organized approach to financial analysis. This guide will explore how to use Excel to work out investments, covering key concepts such as data entry, formula usage, and visualization techniques to help you make the most of your investment data.
What You'll Learn
- Data Input: Enter financial data into Excel for analysis
- Formulas: Utilize Excel functions to calculate returns, risks, and projections
- Charts: Visualize data with charts for better understanding of investment trends
- Risk Analysis: Employ tools to assess and manage investment risks
- Scenario Planning: Create scenarios to predict potential outcomes and make informed decisions
![]()
Data Input: Enter financial data into Excel for analysis
When it comes to analyzing investments, Excel is an invaluable tool, and the first step in this process is accurate data input. This initial step is crucial as it forms the foundation for all subsequent calculations and insights. Here's a guide on how to efficiently enter financial data into Excel for investment analysis:
Organizing Your Data: Begin by creating a structured spreadsheet. Set up columns for various financial attributes such as date, investment type, amount invested, expected returns, and any associated risks. For instance, you might have a column for the 'Investment Date' to track when each investment was made, and another for 'Investment Type' to categorize stocks, bonds, or mutual funds. Ensure that your data is well-organized and easy to navigate, as this will significantly streamline your analysis process.
Data Entry Tips: Accuracy is paramount. When inputting financial data, double-check each entry to minimize errors. Pay close attention to decimal places, especially when dealing with monetary values. Excel's auto-fill feature can be a handy tool for quickly entering repetitive data, but always verify the accuracy of the filled cells. Consider using Excel's data validation tool to restrict input to specific data types, ensuring consistency and reducing the chances of errors.
Utilizing Excel Functions: Excel offers a wide array of functions that can simplify data input and analysis. For instance, the 'SUM' function can quickly calculate the total investment or returns over a period. You can also use the 'AVERAGE' function to find the average return on investment. Additionally, functions like 'VLOOKUP' can help you retrieve specific data points from different parts of the spreadsheet, making data retrieval and analysis more efficient.
Importing Data: For existing financial data, Excel provides the option to import data from various sources. This feature is particularly useful when you have financial information in a different format, such as a CSV file or a web-scraped table. Excel's import function allows you to seamlessly integrate this data into your spreadsheet, ensuring that your analysis is based on comprehensive and up-to-date information.
Data Validation and Consistency: As you input data, maintain consistency by applying formatting and data validation rules. For example, you can ensure that all dates are in a specific format, making it easier to sort and filter data. Excel's data validation tool can also be used to restrict input to a predefined range, preventing the entry of unrealistic or incorrect values. This step is essential to ensure the integrity of your financial analysis.
Detaching from Work: Strategies for Emotional Distance
You may want to see also
![]()
Formulas: Utilize Excel functions to calculate returns, risks, and projections
Excel is a powerful tool for financial analysis, and its built-in functions can greatly simplify the process of calculating investment metrics. Here's a guide on how to use Excel formulas to calculate returns, assess risks, and make projections for your investments:
Calculating Investment Returns:
One of the most fundamental calculations in investing is determining the return on an investment. Excel's `RATE` function can be used to calculate the internal rate of return (IRR), which is the rate at which an investment's future cash flows will equal its initial cost. Here's the formula structure: `=RATE(nper, PV, FV, [FV_status], [type], [guess])`. Here, 'nper' is the total number of periods, 'PV' is the present value, 'FV' is the future value, and 'guess' is an initial estimate for the IRR. You can also use the `XIRR` function for more complex scenarios with irregular cash flows.
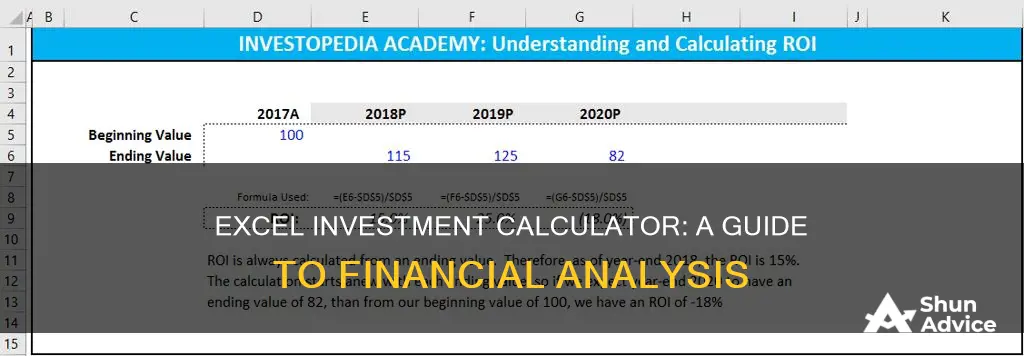
To calculate the simple return, you can use the `=((Ending Value - Starting Value) / Starting Value) * 100` formula. This will give you the percentage return over a specific period.
Risk Assessment:
Excel functions can also help you understand the risk associated with an investment. The `STDEV.P` function calculates the standard deviation of a range of values, which is a measure of the investment's volatility. You can use this to assess the risk of an individual security or a portfolio. Additionally, the `COVAR` function can be used to calculate the covariance between two investment returns, helping you understand the relationship between different assets in your portfolio.
Projections and Forecasting:
Excel's forecasting capabilities are invaluable for investment analysis. The `FORECAST` function predicts a future value based on historical data. For example, if you have historical stock prices, you can use `=FORECAST(x, a, b)` to predict future prices. The `TREND` function is similar but uses a linear trend line for forecasting. These functions are powerful tools for making informed investment decisions.
Using Financial Functions:
Excel's financial functions are specifically designed for investment calculations. The `FV` function calculates the future value of an investment, considering interest rate and compounding frequency. `PV` does the reverse, finding the present value. `NPER` calculates the number of payment periods, and `PMT` determines the payment amount for a loan or investment. These functions are essential for financial modeling and scenario analysis.
Remember, Excel provides a wide range of functions to handle various investment calculations. It's a valuable skill to learn these functions to streamline your investment analysis and decision-making process.
Investment Ratio: Shifting the Savings Curve
You may want to see also
![]()
Charts: Visualize data with charts for better understanding of investment trends
Charts are an essential tool for visualizing data and gaining insights into investment trends. They provide a clear and concise way to present complex information, making it easier to identify patterns, compare values, and make informed decisions. When working with investment data in Excel, creating charts can significantly enhance your understanding of the market and your investment strategies. Here's a step-by-step guide to utilizing charts for better investment analysis:
- Data Preparation: Before creating charts, ensure your data is organized and structured properly. Investment data often includes various categories such as dates, asset names, prices, and quantities. Create columns for each category and ensure the data is consistent and error-free. For example, you might have a column for the date of each transaction, another for the asset's name and symbol, and separate columns for the buy and sell prices, along with the quantity. Proper data organization is crucial for accurate charting.
- Choose the Right Chart Type: Excel offers a wide range of chart types, each suitable for different types of data. For investment analysis, some common chart types include Line Charts, Bar Charts, and Pie Charts. Line charts are excellent for showing trends over time, making it easy to identify price movements. Bar charts are useful for comparing values across different categories, such as comparing the performance of various assets. Pie charts can illustrate the distribution of investments or the proportion of different asset classes in your portfolio. Select the chart type that best represents the relationship and patterns in your investment data.
- Data Visualization: Once you've prepared your data and chosen the chart type, it's time to create the chart. Select the data range you want to visualize and insert the chart. Excel provides a variety of chart styles and customization options. You can modify the chart's appearance, including colors, labels, and gridlines, to make it more informative. For instance, you can add trendlines to highlight key support and resistance levels or use data labels to show individual data points. The goal is to create a chart that effectively communicates the investment story you want to tell.
- Analyze and Interpret: Charts provide a visual representation that can reveal trends and patterns that might not be apparent in raw data. Look for key insights such as upward or downward price trends, seasonality, or correlations between different assets. For example, a line chart showing stock prices over time can quickly reveal a company's performance and potential growth or decline. Bar charts can help compare the performance of different investment funds or asset classes. By analyzing these charts, you can make more informed investment decisions, adjust your strategies, and identify potential opportunities or risks.
- Trend Identification and Forecasting: Charts are powerful tools for identifying investment trends. By studying historical data on charts, you can forecast future price movements and make predictions. For instance, a moving average line on a stock price chart can help identify support and resistance levels, indicating potential buying or selling opportunities. Additionally, you can use technical analysis indicators, such as RSI or MACD, to further enhance your chart analysis and generate buy/sell signals.
In summary, charts are a valuable addition to your Excel toolkit when working with investment data. They provide a visual representation that simplifies complex information, making it easier to understand investment trends and patterns. By following these steps, you can effectively utilize charts to analyze investment data, identify opportunities, and make more strategic investment choices. Remember, the key is to present your data in a way that highlights the most relevant information for your investment goals.
Unveiling the Secrets of Investing in Foreclosed Homes
You may want to see also
![]()
Risk Analysis: Employ tools to assess and manage investment risks
Risk analysis is a critical component of investment management, and Excel provides a powerful toolkit to assess and manage these risks effectively. Here's a step-by-step guide on how to utilize Excel for risk analysis:
- Data Collection and Organization: Begin by gathering relevant data for the investments you are analyzing. This includes historical price data, financial statements, market trends, and any other factors that could influence the investment's performance. Organize this data in Excel sheets, ensuring each investment has a dedicated section. Create columns for dates, prices, financial ratios, and any other metrics you deem important.
- Risk Identification: Identify the types of risks associated with each investment. Common risks include market risk, credit risk, liquidity risk, and operational risk. For example, market risk could be the volatility of stock prices, while credit risk pertains to the ability of a borrower to repay a loan. Create a risk assessment matrix in Excel to categorize and prioritize these risks. Assign weights and scores to each risk factor based on their potential impact and likelihood.
- Risk Measurement and Analysis: Excel offers various tools to measure and analyze investment risks. One common method is Value-at-Risk (VaR), which estimates the potential loss in value of a portfolio over a given time horizon at a certain confidence level. You can calculate VaR using historical data and statistical models. Additionally, sensitivity analysis can be employed to understand how changes in input variables (e.g., interest rates, exchange rates) affect the investment's performance. Create formulas and use Excel's built-in functions to automate these calculations.
- Scenario Analysis: Perform scenario analysis to assess the impact of different market conditions on your investments. Create hypothetical scenarios by adjusting key variables such as market prices, interest rates, or economic indicators. Simulate how these scenarios would affect the investment's value and risk profile. This exercise helps investors understand the potential outcomes and make informed decisions. Use Excel's data manipulation and visualization tools to create scenario tables and charts.
- Risk Mitigation and Management: Based on your risk analysis, develop strategies to mitigate potential losses. This might include diversification, hedging, or implementing stop-loss orders. For instance, you could allocate a portion of the portfolio to low-risk assets to balance out potential losses from high-risk investments. Excel can assist in creating a risk management plan by highlighting areas of concern and suggesting appropriate actions. You can also use pivot tables to summarize and analyze the impact of risk mitigation strategies.
By following these steps, investors can effectively employ Excel to assess and manage investment risks. This process ensures that investment decisions are well-informed, considering various risk factors and their potential impact on the portfolio's performance. Excel's versatility and powerful data analysis capabilities make it an invaluable tool for risk management in the investment industry.
Cutting Out the Middleman: Strategies for Broker-Free Investing
You may want to see also
![]()
Scenario Planning: Create scenarios to predict potential outcomes and make informed decisions
Scenario planning is a powerful tool for investors to explore the potential future outcomes of their investment decisions. It involves creating a range of possible scenarios that could unfold, each with its own set of assumptions and variables, and then analyzing the impact of these scenarios on the investment portfolio. This process allows investors to make more informed choices by considering various market conditions, economic trends, and external factors that could influence their investments.
To begin scenario planning in Excel, you'll need to define the key variables and factors that will influence your investment decisions. These could include economic indicators such as interest rates, inflation, GDP growth, and industry-specific metrics. For example, if you're investing in the technology sector, you might consider variables like technological advancements, regulatory changes, and consumer behavior trends. Create a comprehensive list of these variables and their potential values or ranges, ensuring that you cover a wide spectrum of possibilities.
Next, construct a scenario matrix or table in Excel. This matrix will serve as the foundation for your scenario analysis. In the first column, list the different variables you identified. Then, for each variable, create multiple rows to represent various levels or scenarios. For instance, if interest rates are a key variable, you might have rows for 'Low', 'Medium', and 'High' interest rate scenarios. Repeat this process for all the variables, ensuring that the number of rows reflects the range of potential outcomes you want to explore.
Now, fill in the matrix by assigning specific values or ranges to each cell, based on your research and assumptions. For example, in the interest rate scenario, you might choose values like 2%, 4%, and 6% for the low, medium, and high scenarios, respectively. Ensure that the values are realistic and cover a broad spectrum to capture a variety of potential future states. This step requires careful consideration and judgment, as it forms the basis of your scenario analysis.
Once the matrix is populated, you can start analyzing the impact of each scenario on your investment portfolio. This involves using Excel's functions and formulas to calculate the expected returns, risks, and other relevant metrics for each scenario. You can create formulas to automatically calculate the weighted average of returns or risks based on the scenario probabilities. This quantitative analysis will provide a clear picture of how different market conditions might affect your investments.
Finally, interpret the results and draw conclusions. Compare the performance of your portfolio across various scenarios. Identify the most favorable and unfavorable outcomes, and assess the sensitivity of your investments to changes in market conditions. Scenario planning enables you to make strategic decisions, such as adjusting asset allocations, diversifying investments, or implementing risk management strategies, based on the insights gained from this analysis. It empowers investors to be proactive rather than reactive, ensuring that their investment strategies are robust and adaptable to different future scenarios.
Unveiling Zack Investment: A Comprehensive Review of Its Legitimacy
You may want to see also
Frequently asked questions
To calculate the total return, you can use the formula: Total Return = (Ending Value - Starting Value) / Starting Value. This formula will give you the percentage return on your investment. You can also use the 'XIRR' function in Excel, which calculates the internal rate of return, providing a more comprehensive view of the investment's performance.
Absolutely! You can set up a cash flow projection by creating a table or spreadsheet with columns for dates, expected cash inflows, and outflows. Then, you can use formulas to calculate the cumulative cash flow and project future values. This will help you visualize the investment's cash flow pattern and make informed decisions.
Excel offers various tools for tracking and analyzing investment data. You can create a summary sheet with columns for investment details, purchase/sale prices, holding periods, and returns. Use pivot tables to group and summarize data, and create charts to visualize performance over time. Additionally, you can use the 'Goal Seek' or 'Solver' tools to optimize investment strategies and make data-driven adjustments.