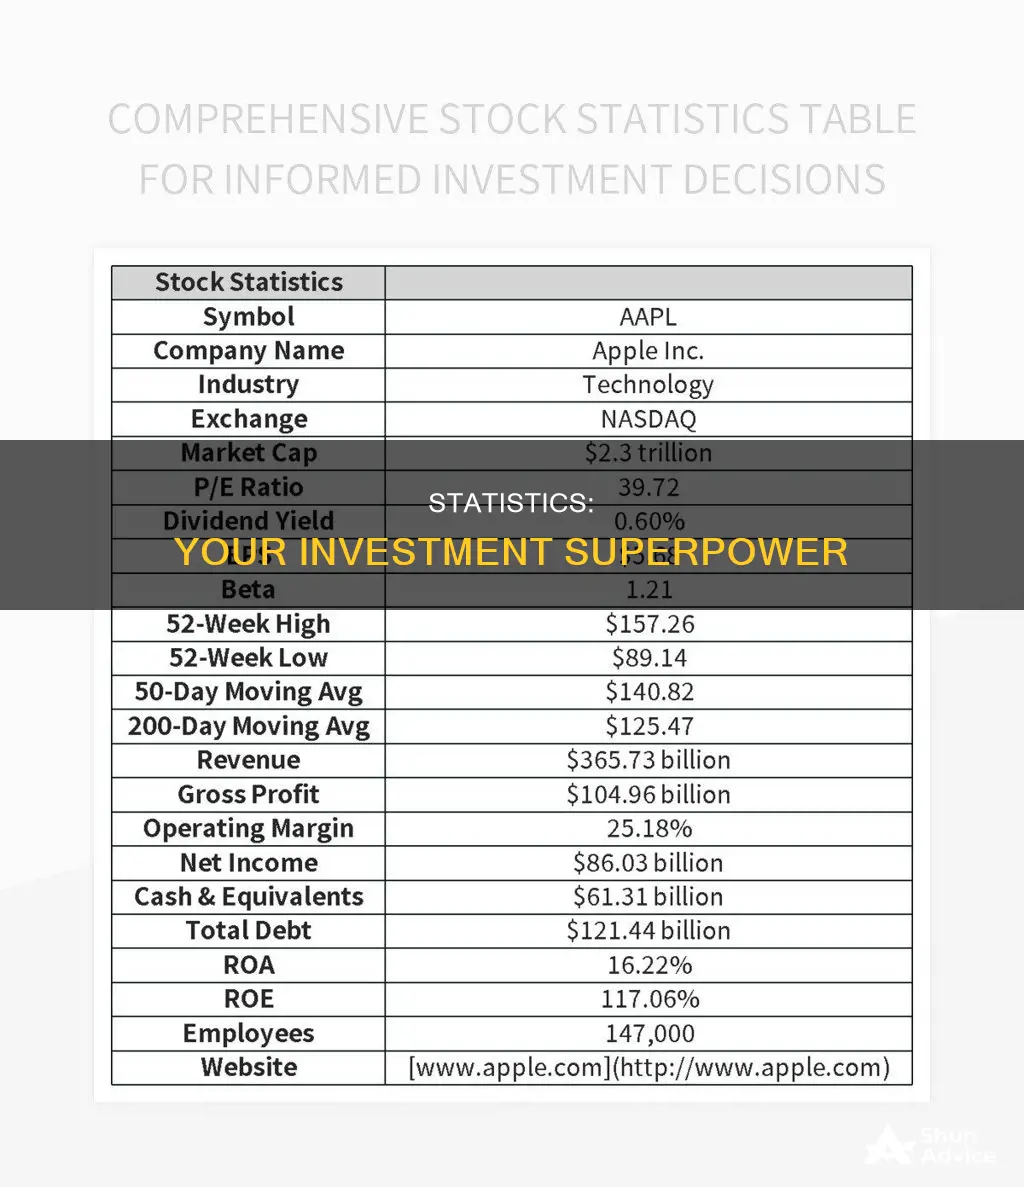
Statistics are an essential tool for investors to make informed decisions and comprehend market trends. They provide valuable insights into historical investment data, enabling investors to identify patterns and develop strategies. Quantitative analysis, for example, uses mathematical and statistical models to determine the value of financial assets. By analysing various data points, investors can make profitable decisions and manage risk effectively. Statistics also help investors monitor the performance of their portfolios, allowing them to adjust their strategies as needed. While statistics are crucial, they should be used alongside other analytical tools and not in isolation.
| Characteristics | Values |
|---|---|
| Purpose of Statistics in Investment | To provide information for investors to form expectations and make decisions, understand how everything works, and convince stakeholders of their worth |
| Type of Stats Used by Investors | Real economic/company fundamentals, financial prices, instrument-specific information, expectations, and alternative data |
| Data Dimension | Time, spatial and relative value, interplay of expectations, hard economic data, and financial prices |
| Statistical Analysis | Mean return on investment, geometric mean, median, weighted average return, relative and cumulative frequency, frequency distribution charts |
| Quantitative Analysis | Used to determine the value of a financial asset, develop trading algorithms and computer models, and make profitable investment decisions |
| Investment Statistics | Annual return of the S&P 500, average annual inflation rate, number of active day traders who lose money, cost of index fund vs. active fund, average length of a bear market, number of people with a workplace retirement plan, average Baby Boomer 401(k) balance |
What You'll Learn

Price-to-book ratio
The Price-to-Book (P/B) ratio is a key financial indicator used to evaluate a company's value. It is calculated by dividing the market value per share by the book value per share. The market value per share is the current trading price of a single share of the company's stock, while the book value per share is the company's total assets minus its total liabilities, divided by the number of outstanding shares.
The P/B ratio is an important tool for investors as it helps them gauge whether a stock is a good buy or not. A P/B ratio of one means that the stock price is trading in line with the book value of the company. A ratio lower than one indicates that a stock may be undervalued, while a ratio higher than one suggests that the stock may be overvalued.
For example, let's consider a company with a book value per share of $30 and a market value per share of $45. The P/B ratio would be 1.5, indicating that an investor is paying $1.50 for every dollar of the company's book value. This could suggest that the market has high expectations for the company's future performance or that the stock is overvalued.
It is important to note that the P/B ratio has its limitations. It is most applicable to companies in asset-heavy industries and does not consider intangible assets such as brand value, patents, or intellectual property. Therefore, investors should use the P/B ratio in conjunction with other financial metrics and analysis methods to make well-informed investment decisions.
Cash Flows: Investing Activity or Not?
You may want to see also

Price-to-sales ratio
The price-to-sales (P/S) ratio is a valuation ratio that compares a company's stock price to its revenues or sales. It is calculated by dividing the stock price by the underlying company's sales per share, or by dividing the company's market capitalization by its total sales over a designated period (usually 12 months). The P/S ratio is a key analysis and valuation tool for investors and analysts, revealing how much investors are willing to pay per dollar of sales.
A low P/S ratio could indicate that a stock is undervalued, while a higher-than-average ratio could suggest overvaluation. For example, a company with a P/S ratio of 0.75 to 1.5 may be considered a strong buy, whereas a ratio greater than three is deemed high-risk. However, a low P/S ratio is not the only metric to consider, as companies with high growth potential often have higher ratios.
The P/S ratio is most relevant when used to compare companies within the same sector, as it doesn't take into account whether the company makes any earnings or whether it will ever make earnings, making it difficult to compare companies in different industries. For instance, a company that makes video games will have different capabilities when turning sales into profits compared to a grocery retailer. Additionally, the P/S ratio does not account for debt loads or the status of a company's balance sheet.
Despite these limitations, the P/S ratio can be a valuable tool for investors, especially when used in conjunction with other valuation indicators such as the price-to-earnings (P/E) ratio. It provides insights into a company's revenue generation capability, growth potential, and market position.
Investment Bankers: Crafting Precise Cash Flow Statements
You may want to see also

PEG ratio
The Price/Earnings-to-Growth (PEG) Ratio is a valuable tool for investors to assess the intrinsic value of a stock. It is calculated by taking the Price/Earnings (P/E) Ratio and dividing it by the Earnings per Share Growth (EPS) over a specific period, typically 1-3 years. This formula helps to adjust companies with high growth rates and high price-to-earnings ratios.
The PEG ratio is considered an indicator of a stock's true value and is a more comprehensive measure than the standard P/E ratio. A lower PEG ratio suggests that a stock is undervalued and may be a good investment opportunity. Conversely, a PEG ratio greater than 1.0 indicates that a stock is overvalued.
PEG = Share Price / Earnings per share / Earnings per Share growth rate
For example, if a company has a Price/Earnings Ratio of 12 and an Earnings per Share of 15%, the PEG ratio would be calculated as follows:
12 / 15% = 0.80
This indicates that the share price is lower compared to the company's anticipated earnings.
It is important to note that the PEG ratio is sensitive to the growth rate used in the calculation. It can be calculated using projected growth rates for different periods, such as one, three, or five years. The terms "forward PEG" and "trailing PEG" are used to distinguish between calculations using future and historical growth rates, respectively.
When evaluating potential investments, it is advisable to use the PEG ratio in conjunction with other financial ratios and analysis tools to make a well-informed decision.
Using CAOM: Smart Investing Strategies for Long-Term Success
You may want to see also

Capital gains tax
If an asset is sold for more than its purchase price, the difference is considered a capital gain. However, it is important to remember that most possessions depreciate over time, so the sale of such possessions will not be considered capital gains. Nevertheless, any asset that is purchased and resold for a profit is subject to capital gains tax. This includes artwork, vintage cars, boats, jewellery, and other similar items.
Real estate and collectibles, such as art and antiques, are subject to special capital gains rules, which may result in higher tax rates. Additionally, profits from the sale of cryptocurrencies, such as Bitcoin, are also subject to capital gains tax.
How Capital Gains Taxes Work
If an asset is purchased for $5,000 and sold in the same year for $5,500, a short-term capital gain of $500 is realised. If the individual is in the 22% tax bracket, they would owe the IRS $110 of their $500 capital gains, resulting in a net gain of $390. However, if they hold onto the asset for more than a year and then sell it for a profit of $700, it becomes a long-term capital gain. If their total income is $50,000, they would fall into the 15% tax bracket for long-term capital gains, resulting in a tax payment of $105 and a net profit of $595.
There are several strategies that can be employed to minimise capital gains tax liability:
- Use tax-advantaged retirement plans: By holding assets in tax-advantaged accounts, such as a 401(k), traditional IRA, solo 401(k), or SEP IRA, investors can delay paying capital gains taxes while maximising growth. These accounts allow investments to grow tax-deferred, and taxes are typically only incurred upon withdrawal, usually after retirement age (59 1/2 according to the IRS).
- Monitor holding periods: By holding securities for at least a year, investors can ensure that any profits are treated as long-term gains, which are typically taxed at more favourable rates compared to short-term gains.
- Keep records of losses: Selling underperforming securities to incur a capital loss can help offset capital gains liability. Additionally, if capital losses exceed this threshold, the excess amount can be carried forward into the next tax year and beyond.
- Stay invested and know when to sell: Waiting to sell profitable investments until retirement, or until income is lower, can significantly reduce tax liability. This is because income tax rate is a key factor in determining capital gains tax.
- Speak with a tax professional: Federal and state tax laws are complex and ever-changing, so consulting a tax advisor can help individuals maximise their income potential through tailored strategies.
Special tax rules apply to the sale of real estate. For profits on the sale of a primary residence to be considered long-term capital gains, the property must be owned and lived in for two of the five years preceding the sale. In this case, individuals can exempt up to $250,000 in profits from capital gains taxes, while married couples filing jointly can exempt up to $500,000. However, if a house is flipped and sold within a year, a steep short-term capital gains tax may apply.
Additionally, a 25% rate applies to gains from the sale of investment property, as this type of property is typically depreciated over time. This rule aims to recapture some of the tax breaks received through depreciation deductions.
Investing Cash During Inflation: Strategies for Success
You may want to see also

Price-to-earnings ratio
The price-to-earnings (P/E) ratio is a widely used metric for investors and analysts to determine a stock's valuation and relative value. It is calculated by dividing the market value price per share by the company's earnings per share (EPS). A high P/E ratio could mean that a company's stock is overvalued, or that investors expect high growth rates. Conversely, a low P/E ratio could indicate that a company's stock is undervalued or that the company is performing well relative to its past performance.
The P/E ratio is a useful tool for comparing a company's valuation against its historical performance, against other firms within its industry, or against the broader market. It is especially valuable when comparing similar companies in the same industry or for tracking a single company over time.
The two most commonly used P/E ratios are the forward P/E and the trailing P/E. The forward P/E uses future earnings guidance, while the trailing P/E relies on past performance by dividing the current share price by the total EPS for the previous 12 months.
While the P/E ratio is a handy tool, it has some limitations. It does not account for future earnings growth, can be influenced by accounting practices, and may not be comparable across different industries. Additionally, it does not consider other financial aspects such as debt levels, cash flow, or the quality of earnings. As such, it should be used alongside other financial measures to gain a complete picture of a company's financial health and stock valuation.
Robinhood Investing: A Beginner's Guide to Getting Started
You may want to see also
Frequently asked questions
Quantitative analysis uses statistical models and data to make predictions, whereas qualitative analysis uses subjective, non-numerical data such as opinions and attitudes.
Statistics provide data and information that help investors form expectations and make decisions with calculated risk.
Statistics can be used to calculate the mean return on investment of a portfolio over a specified time period, helping investors monitor performance and identify market trends.
The Price-to-Book Ratio (P/B Ratio) compares a company's market value to its book value, indicating whether a company is undervalued or overvalued compared to similar companies.
Statistics like the Price-to-Sales Ratio (PSR) and the Price-to-Earnings Growth Ratio (PEG Ratio) can help investors identify undervalued stocks by comparing a company's stock price to its sales and earnings growth.


