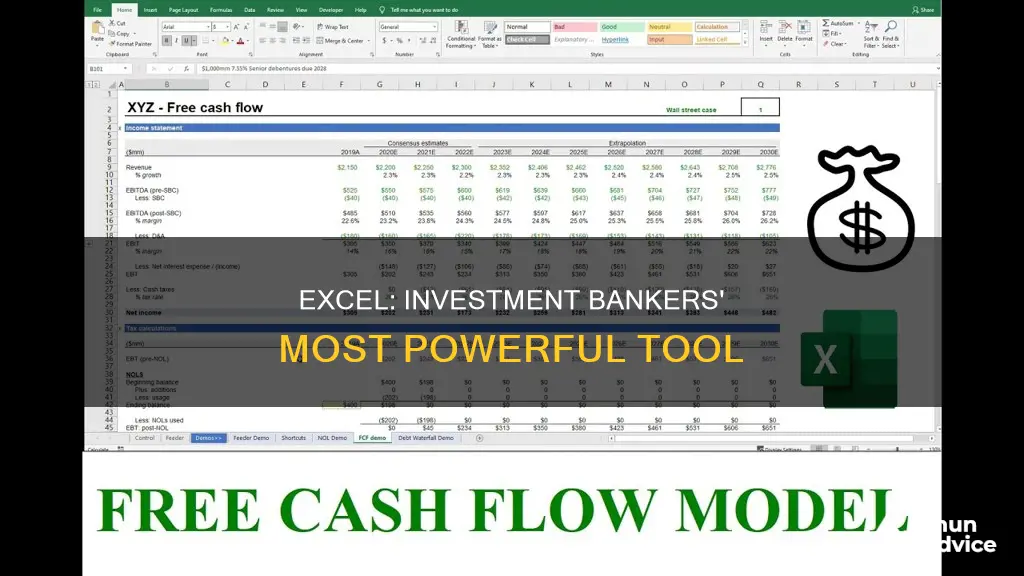
Investment bankers use Excel for a variety of tasks, including financial modelling, data analysis, and creating presentations. Excel is a versatile tool that allows bankers to perform quantitative analysis, such as return sensitivity, accretion math, and data mining. It is also used for creating dynamic spreadsheets, which involve building models that forecast cash flow projections and advise clients on financial decisions. Additionally, investment bankers use Excel for sorting and formatting data, generating company profiles, and performing calculations. Proficiency in Excel is considered essential for aspiring junior analysts or associates in investment banking.
| Characteristics | Values |
|---|---|
| Used for quantitative analysis | Return sensitivity, accretion math, and data mining |
| Used for financial modelling | Discounted Cash Flow, Leveraged Buyout Model, Comparable Company Analysis Model, Mergers and Acquisitions Model |
| Used for formatting | Cells with inputs should be blue, formulas should be black, cells with unique formulas should be shaded |
| Used for data sorting | Sort and format data, spread comps, create company profiles |

Quantitative analysis
Investment bankers use Excel for quantitative analysis, which involves using mathematical and statistical analysis to determine the value of a financial asset, such as a stock or option. This process helps them make informed decisions about investment opportunities.
Excel is used to perform complex calculations and create financial models that aid in quantitative analysis. These models can be used to predict future outcomes, assess a company's financial health, and inform investment decisions.
In quantitative analysis, investment bankers use Excel to collect, organize, and analyze large datasets. They employ various formulas, functions, and charting features to identify patterns and trends in the data. By utilizing the flexibility and computational capabilities of Excel, bankers can make data-driven decisions with speed and precision.
Additionally, investment bankers use Excel to calculate metrics such as the Internal Rate of Return (IRR) to evaluate the profitability and viability of investments. IRR helps determine if a project is worth the cost by matching project returns to costs.
Overall, Excel is a powerful tool that enables investment bankers to conduct quantitative analysis efficiently and effectively, making it an essential skill for aspiring professionals in the field.
Cashing Out on Robinhood: A Guide to Withdrawing Your Investments
You may want to see also

Formatting
Firstly, input cells should be blue, formula cells/links to other cells should be black, and links to other tabs/worksheets should be green. Additionally, links to other workbooks should be purple, cells that need to be updated should be red, and assumptions that need to be firmed up should be pink. These formatting choices make the spreadsheet easy to follow and allow for quick identification of errors.
Another important formatting rule is to avoid hiding rows or columns unless they are grouped first. This is because formulas often include hidden rows or columns, and if someone copies a formula over the entire spreadsheet, the analysis could be incorrect. It is also crucial to check for links from external workbooks, as these should not exist unless there is a specific reason.
Investment bankers also need to pay attention to the formatting of their data tables. These can be challenging to understand, even for those who use them frequently. It is helpful to write down the data table inputs in a comment or adjacent cells to make it easier for others to understand.
Finally, investment bankers should avoid "Excel litter". This refers to leaving random formulas and numbers on the spreadsheet that are not relevant to the analysis. It is important to keep the spreadsheet clean and simple, with only the necessary information included.
By following these formatting guidelines, investment bankers can ensure that their spreadsheets are well-organized, easy to understand, and free from errors.
Understanding Present Value Tables: A Guide to Smart Investing
You may want to see also

Data analysis
Investment bankers use Excel for data analysis, and it is one of the most crucial tools in their arsenal. The software is used to simplify complex data, making it easier to understand and communicate with clients and colleagues. Excel's data analysis features allow investment bankers to create easy-to-read charts and graphs, which are essential for quick understanding, informed decision-making, and effective communication.
Excel's versatility and power make it indispensable in investment banking. Its data analysis capabilities include a wide range of formulas, functions, and shortcuts that enable bankers to manipulate data efficiently. One of the most commonly used features is data visualisation tools, such as charts and graphs, which help illustrate market trends clearly. For example, line charts are commonly used to monitor stock prices and track financial ratios over time. Bar charts are used to compare financial metrics across different business segments, such as revenues or expenses by unit, product line, region, or department. Pie charts are employed to break down data like capital allocation or market share, providing a quick assessment of each category's contribution to the whole.
Additionally, investment bankers use advanced Excel features such as pivot tables, formulas, and macros to streamline repetitive tasks and save time. They also utilise lookup formulas like VLOOKUP and INDEX-MATCH to search and find results within large datasets efficiently.
Excel's data analysis capabilities are further enhanced by its scenario analysis feature, which enables bankers to predict various financial outcomes and make informed decisions. The software's real-time calculations and ability to handle complex financial modelling make it a powerful tool for investment bankers to gain insights into financial statements and valuation models.
In summary, investment bankers rely heavily on Excel for data analysis due to its versatility, advanced features, and data visualisation capabilities. The software enables them to simplify complex data, create informative charts, and make data-driven decisions efficiently.
Understanding Investment Pool VIC 3: A Guide to Smart Investing
You may want to see also

Financial modelling
Investment bankers use Excel for financial modelling, which is a spreadsheet-based abstraction of a real company that helps estimate the company's future cash flows, financing requirements, valuation, and whether or not to invest in the company. Financial modelling is also used to assess the viability of acquisitions and the development of new assets.
There are several types of financial models used in investment banking, including:
- Three-Statement Model: This is the most basic setup, linking the income statement, balance sheet, and cash flow statement with formulas in Excel.
- Discounted Cash Flow (DCF) Model: Builds on the three-statement model to value a company based on future cash flows, discounted to the present using the company's weighted average cost of capital (WACC).
- Merger Model (M&A): Evaluates the financial impact of a merger or acquisition, including accretion/dilution analysis and the impact on earnings per share (EPS).
- Initial Public Offering (IPO) Model: Used to value a company before going public, considering comparable company analysis and investor willingness to pay.
- Leveraged Buyout (LBO) Model: Analyses complicated debt schedules and is often used in private equity or investment banking.
- Sum of the Parts Model: Combines multiple DCF models and adds other components to value a company.
- Forecasting Model: Used in financial planning and analysis to build forecasts and compare them to budget models.
- Option Pricing Model: Uses mathematical formulas to price financial derivatives, such as options and futures contracts.
Understanding Cash Flows from Ordinary Investing Activities
You may want to see also

Data processing
Investment bankers use Excel for data processing to structure, analyse and visualise large, complex datasets. The software's data analysis and visualisation features are particularly useful for simplifying complex data into easy-to-read charts and graphs. This makes it easier to identify patterns, communicate with clients and colleagues, and make informed decisions.
Excel is used to track how values change over time, allowing investment bankers to monitor stock prices and track key financial ratios. For example, a line chart can be used to visualise a company's stock price trajectory over a given period. Bar charts are used to compare financial metrics across different business segments, such as revenues or expenses by unit, product line, region or department. Pie charts are used to break down data like capital allocation or market share, showing the allocation of a portfolio within an investment fund.
Excel's data processing capabilities also extend to scatter plots, which are used to evaluate and communicate the relationships between two variables, such as the risk-return trade-off of potential investments. Histograms are used to analyse the distribution of values within large datasets, such as market returns or transaction sizes. Area charts are used to visualise how a total quantity changes over time, allowing for breakdowns by category. Waterfall charts, or bridge charts, are used to show the components of a net change in value, such as financial statement flows or deal accretion/dilution.
In addition to its charting capabilities, Excel is used for data processing in investment banking due to its flexibility, ease of use, and computational capabilities. It allows for the substitution of layouts, inputs and formulas according to the specifications of the financial model in question. Excel also has specialised functions and formulas for financial analysis, such as VLOOKUP, SUMIFS and INDEX MATCH.
Investing with Probability: Making Informed Decisions
You may want to see also
Frequently asked questions
Investment bankers use Excel to advise their clients. Financial modelling is the process of representing a real-world financial situation on a model. The model forecasts how much cash flow a project is expected to make.
The four most common types of financial models used in investment banking are:
- Discounted Cash Flow
- Leveraged Buyout Model
- Comparable Company Analysis Model
- Mergers and Acquisitions Model
Investment bankers use Excel for quantitative analysis, including return sensitivity, accretion math, and data mining. They also use it to create company profiles, spread comps, and format data.
Some best practices for using Excel in investment banking include:
- Ensuring that input cells/assumptions are blue so that when the value of an input cell changes, the outputs change accordingly.
- Making formulas that are impacted by input cells or other formulas black.
- Using green for links to other tabs/worksheets.
- Using purple for links to other workbooks.


