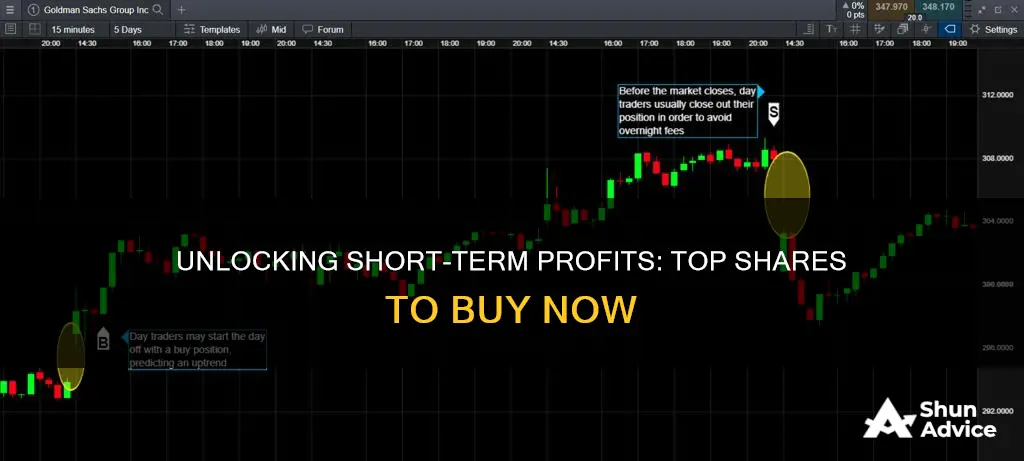
When considering short-term investments, choosing the right stock to buy can be a challenging task. Investors often seek opportunities that offer potential for quick returns within a relatively short timeframe. This could involve identifying companies with strong growth prospects, solid fundamentals, and a history of consistent performance. Additionally, factors such as market trends, economic indicators, and industry-specific news can influence investment decisions. In this article, we will explore various strategies and considerations to help investors make informed choices, providing insights into potential stocks that could be suitable for short-term investment opportunities.
What You'll Learn
- Market Timing: Identify optimal entry points for short-term gains
- Volatility Analysis: Assess market fluctuations to make informed investment decisions
- Technical Indicators: Utilize charts and patterns for quick trading strategies
- News and Events: Stay updated to capitalize on short-term market opportunities
- Risk Management: Implement strategies to minimize potential losses in short-term trades
![]()
Market Timing: Identify optimal entry points for short-term gains
Market timing is a crucial skill for short-term investors, as it involves identifying the right moment to enter the market to maximize potential gains. This strategy requires a keen understanding of market trends, technical analysis, and a well-defined investment plan. Here's a guide to help you master the art of market timing for short-term investments:
- Trend Analysis: One of the fundamental aspects of market timing is recognizing market trends. Investors should focus on identifying whether the market is in an uptrend, downtrend, or a consolidation phase. Uptrends are characterized by rising prices, indicating a positive market sentiment and potential opportunities for short-term gains. Conversely, downtrends show declining prices, suggesting a bearish market and potential risks. Consolidation periods, where prices fluctuate within a narrow range, can be a sign of market indecision and may present entry points for traders looking to capitalize on short-term volatility.
- Technical Indicators: Technical analysis tools are essential for short-term traders to pinpoint optimal entry points. Moving averages, such as the Simple Moving Average (SMA) and Exponential Moving Average (EMA), can provide valuable insights. Traders often look for crossovers between short-term and long-term moving averages, as these can signal potential trend changes. For example, a short-term EMA crossing above a long-term SMA might indicate a bullish signal, prompting investors to buy. Similarly, the Relative Strength Index (RSI) can help identify overbought or oversold conditions, allowing traders to enter or exit positions accordingly.
- Support and Resistance Levels: Identifying support and resistance levels is crucial for market timing. These levels represent price points where the market tends to reverse or pause. Support levels are where buyers are expected to enter the market, potentially driving prices higher. Resistance levels, on the other hand, are areas where sellers might emerge, causing prices to decline. Traders can use these levels to set stop-loss orders, limiting potential losses, and take-profit targets to secure gains.
- News and Events: Keeping an eye on market news and events is essential for short-term investors. Economic data releases, corporate announcements, and geopolitical events can significantly impact share prices in the short term. For instance, positive economic data might boost market sentiment, leading to a surge in stock prices, while negative news could trigger a sell-off. Being aware of these factors allows investors to anticipate potential market movements and make informed decisions.
- Risk Management: Market timing is a high-risk strategy, especially in the short term. It's crucial to manage risk effectively. Set clear stop-loss orders to limit potential losses and consider using position sizing techniques to control the impact of any single trade on your overall portfolio. Diversification is also key; spread your investments across different sectors and asset classes to mitigate risks associated with specific market trends or events.
Mastering market timing requires practice, discipline, and a deep understanding of market dynamics. It's essential to combine technical analysis with a solid investment strategy and risk management techniques to increase the chances of success in the short-term investment game. Remember, successful market timing is not just about identifying the right entry points but also about knowing when to exit to secure profits.
Nurture Your Future Self: A Guide to Long-Term Self-Investment
You may want to see also
![]()
Volatility Analysis: Assess market fluctuations to make informed investment decisions
Volatility analysis is a critical tool for investors seeking to make informed decisions, especially in the realm of short-term investments. It involves assessing the degree of price fluctuation in a market or a specific asset over a given period. This analysis is essential because it provides insights into the risk and potential rewards associated with an investment. By understanding volatility, investors can better navigate the dynamic nature of financial markets and make strategic choices.
When conducting volatility analysis, investors should consider historical price data and identify patterns or trends. This includes examining price movements over various time frames, such as daily, weekly, or monthly intervals. For instance, a stock's price history might reveal consistent upward trends during specific seasons, indicating potential volatility around those times. Identifying such patterns can help investors anticipate market behavior and make timely investment decisions.
One key aspect of volatility analysis is understanding the concept of beta. Beta measures the volatility of a security in relation to the overall market. A beta of 1 indicates that the security's price moves in line with the market, while a beta greater than 1 suggests higher volatility. For short-term investors, focusing on stocks with low beta values can be advantageous, as these securities tend to be less sensitive to market fluctuations, providing a more stable investment option.
Additionally, investors should pay attention to market indicators and sentiment analysis. Monitoring economic data, news, and social media sentiment can provide valuable insights into market volatility. For example, a sudden increase in market volatility might be preceded by negative news or economic indicators, allowing investors to anticipate potential price movements and adjust their strategies accordingly.
In the context of short-term investments, volatility analysis becomes even more crucial. Short-term traders often aim to capitalize on rapid price changes, making it essential to identify assets with high liquidity and low transaction costs. Volatility analysis helps in selecting stocks that are more likely to experience significant price movements within a short period, enabling traders to make quick and informed decisions. By combining technical analysis, market trends, and volatility assessment, investors can develop a comprehensive strategy to navigate the ever-changing financial landscape.
Maximizing Manager's Cash: Strategic Short-Term Investment Opportunities
You may want to see also
![]()
Technical Indicators: Utilize charts and patterns for quick trading strategies
Technical indicators are powerful tools for traders seeking to make quick and informed decisions in the short-term market. These indicators are mathematical calculations based on historical price and volume data, designed to provide insights into potential price movements and trends. By utilizing charts and patterns, traders can identify entry and exit points, manage risk, and make strategic choices. Here's a breakdown of how to effectively use technical indicators for short-term trading:
Understanding Charts and Patterns:
Charts are visual representations of price data, often in the form of candlestick or bar charts. Each candlestick or bar represents a specific time period, typically a day, hour, or minute. Technical analysts look for various patterns and formations within these charts to predict future price movements. Common patterns include head and shoulders, double tops/bottoms, triangles, and flags. For instance, a head and shoulders pattern suggests a potential trend reversal, while a triangle formation indicates a period of consolidation before a breakout.
Key Technical Indicators:
- Moving Averages: These smooth out price data and help identify trends. Short-term traders often use 50-day or 200-day moving averages to determine support and resistance levels. Crossing these moving averages can signal a potential trend change.
- Relative Strength Index (RSI): RSI measures the speed and change of price movements to assess overbought or oversold conditions. A reading above 70 suggests overbought, while below 30 indicates oversold. Traders use these levels to anticipate potential reversals.
- Moving Average Convergence Divergence (MACD): MACD is a trend-following momentum indicator. It consists of two moving averages and a signal line. Crossovers between the MACD and signal line can generate buy or sell signals.
- Bollinger Bands: These bands consist of a moving average and two outer lines, which are standard deviations above and below the moving average. The bands widen and narrow, providing insights into volatility. A break above the upper band suggests high volatility and potential upward movement.
Trading Strategies:
- Trend Following: Identify the primary trend using moving averages and RSI. Buy shares when the short-term moving average crosses above the long-term one and RSI is above 50, indicating a strong uptrend.
- Breakout Trading: Look for price breakouts from chart patterns or support/resistance levels. Buy when the price breaks above a resistance level, confirmed by a volume increase.
- Overbought/Oversold Trading: Use RSI to identify overbought and oversold conditions. Sell when RSI reaches 70, and buy when it drops below 30, anticipating a price correction.
- Volume Analysis: Monitor trading volume to confirm price movements. Increased volume during a price breakout adds strength to the signal.
In short-term trading, technical indicators provide a structured approach to decision-making. By analyzing charts and patterns, traders can quickly identify potential opportunities and manage risks effectively. Remember, these indicators should be used in conjunction with other factors, such as fundamental analysis and market news, for a comprehensive investment strategy.
Understanding the Nature of Long-Term Investments: Operating Assets or Not?
You may want to see also
![]()
News and Events: Stay updated to capitalize on short-term market opportunities
In today's fast-paced financial markets, staying informed is crucial for those seeking short-term investment gains. The key to success in this arena is often found in the timely acquisition of relevant news and events that can significantly impact stock prices. Here's a guide on how to leverage news and events for short-term investment opportunities:
News Sources and Alerts: Begin by identifying reliable news sources that provide real-time market updates. Financial news websites, reputable business publications, and news aggregators are excellent resources. Set up alerts for specific stocks or industries you're interested in. These alerts can notify you of recent developments, earnings reports, or industry-specific news that could influence share prices. For instance, a sudden announcement of a major contract win by a tech company could spark a short-term rally in its stock.
Market Sentiment and Social Media: Social media platforms have become powerful tools for gauging market sentiment. Twitter, in particular, is a hub of real-time market chatter. Follow influential investors, analysts, and industry experts on these platforms to get a pulse on market trends. A positive tweet from a well-known analyst about a particular stock can drive its price higher in the short term. Conversely, negative sentiment or rumors can lead to rapid price declines, offering short-term traders an opportunity to capitalize on a quick sell-off.
Earnings Reports and Financial Results: Corporate earnings reports are critical events that can significantly move stock prices. Short-term investors should pay close attention to these reports, as they provide insights into a company's financial health and future prospects. Positive earnings surprises often lead to a surge in stock prices, while disappointing results can cause a sharp decline. Keep an eye on the calendar for key earnings release dates and be prepared to act swiftly if a company beats or misses expectations.
Economic Indicators and Policy Changes: Economic data releases and policy decisions by governments and central banks can have immediate effects on the market. For instance, interest rate hikes or cuts can impact various sectors, and traders should be aware of these changes. Similarly, economic indicators like GDP growth, inflation rates, and employment data can influence market sentiment and drive short-term market movements. Staying updated on these events can help investors make informed decisions about which shares to buy or sell.
Stay Informed, Act Swiftly: The ability to act quickly is essential in short-term trading. News and events can create short-lived opportunities, and being the first to react can lead to substantial gains. However, it's crucial to balance speed with caution. Conduct thorough research, consider multiple sources, and make well-informed decisions. Short-term trading is a dynamic process, and staying updated ensures you can capitalize on market fluctuations effectively.
Unlocking the Long-Term: 5 Years as a Strategic Investment Horizon
You may want to see also
![]()
Risk Management: Implement strategies to minimize potential losses in short-term trades
In the realm of short-term investing, risk management is paramount to safeguarding your capital and ensuring that your trades don't result in unnecessary losses. Here are some strategies to consider when aiming to minimize potential losses in your short-term trades:
- Define Your Risk Tolerance: Before entering any trade, it's crucial to understand your risk tolerance. This involves assessing how much volatility or potential loss you are comfortable with. Short-term trades often carry higher risks due to market fluctuations and the potential for rapid price changes. Determine your risk appetite and set a threshold for the maximum allowable loss per trade. This self-awareness will guide your decision-making process.
- Diversify Your Portfolio: Diversification is a powerful risk management tool. Instead of concentrating your investments in a single stock or sector, spread your capital across multiple assets. Diversification helps reduce the impact of any single trade's performance on your overall portfolio. Consider investing in various sectors, industries, and asset classes to create a well-rounded portfolio. This approach ensures that your short-term trades are not overly exposed to any one market event or company-specific risk.
- Set Stop-Loss Orders: A stop-loss order is a powerful risk management technique that automatically triggers a trade when a specified price level is reached. By setting a stop-loss, you limit the potential downside risk. For short-term trades, consider placing stop-loss orders at a level that aligns with your risk tolerance. This strategy helps protect your capital by automatically selling if the market moves against your position, ensuring you don't incur substantial losses.
- Practice Position Sizing: Proper position sizing is essential for risk management. Determine the appropriate amount of capital to allocate to each trade based on your risk tolerance and the trade's potential risk. A common rule of thumb is to risk only a small percentage of your trading capital on each trade. For instance, if you have a $10,000 trading account, consider risking no more than 1-2% on any single trade. This approach ensures that even if a trade goes against you, the impact on your overall portfolio is minimized.
- Monitor and Adjust: Short-term markets can be highly volatile, so active monitoring is crucial. Regularly review your trades and the market conditions to make informed decisions. If a trade is not performing as expected or market conditions change, be prepared to adjust your strategy. This might involve taking profits early, cutting losses, or reevaluating your position sizing. Active management and adaptability are key to successful short-term risk management.
- Learn from Market Analysis: Stay informed about market trends, news, and analysis. Utilize technical and fundamental analysis to identify potential trading opportunities and risks. By understanding market dynamics, you can make more informed decisions and anticipate potential price movements. This knowledge will enable you to set more accurate stop-loss levels and adjust your strategies accordingly.
Implementing these risk management strategies will help you navigate the short-term investment landscape more effectively, ensuring that your trades are well-protected and aligned with your investment goals. Remember, successful short-term investing requires a disciplined approach to risk, combining thorough research, strategic planning, and timely execution.
Unlocking Your Financial Future: Strategies for Medium-Term Investment Success
You may want to see also
Frequently asked questions
For short-term investments, it's crucial to focus on stocks with strong growth potential and relatively low risk. Look for companies with a history of consistent performance, solid fundamentals, and a positive outlook. Tech startups, innovative businesses, or those in sectors with high growth rates can be attractive options. However, it's essential to diversify your portfolio to manage risk effectively.
Individual stocks offer more control and the potential for higher returns, but they also carry higher risk. Index funds, on the other hand, provide instant diversification by tracking a specific market index. For short-term gains, individual stocks with strong momentum and positive news flow can be considered. However, index funds are generally more suitable for long-term investors seeking consistent performance.
When making a short-term investment, consider the following: recent price performance, earnings reports, company news, industry trends, and market sentiment. Look for stocks with positive catalysts, such as upcoming product launches, earnings beats, or favorable regulatory changes. Additionally, monitor trading volume to identify potential price movements.
Sectors like technology, healthcare, and consumer discretionary often exhibit higher volatility and can provide short-term trading opportunities. These sectors are driven by innovation, product releases, and market trends, making them attractive for active traders. However, it's important to stay updated on industry-specific news and regulations that may impact stock prices.
Technical analysis involves studying historical price and volume data to identify patterns and trends. It helps traders make informed decisions by providing insights into potential price movements. Key technical indicators include moving averages, relative strength index (RSI), and volume analysis. Combining technical analysis with fundamental research can enhance the accuracy of short-term investment choices.